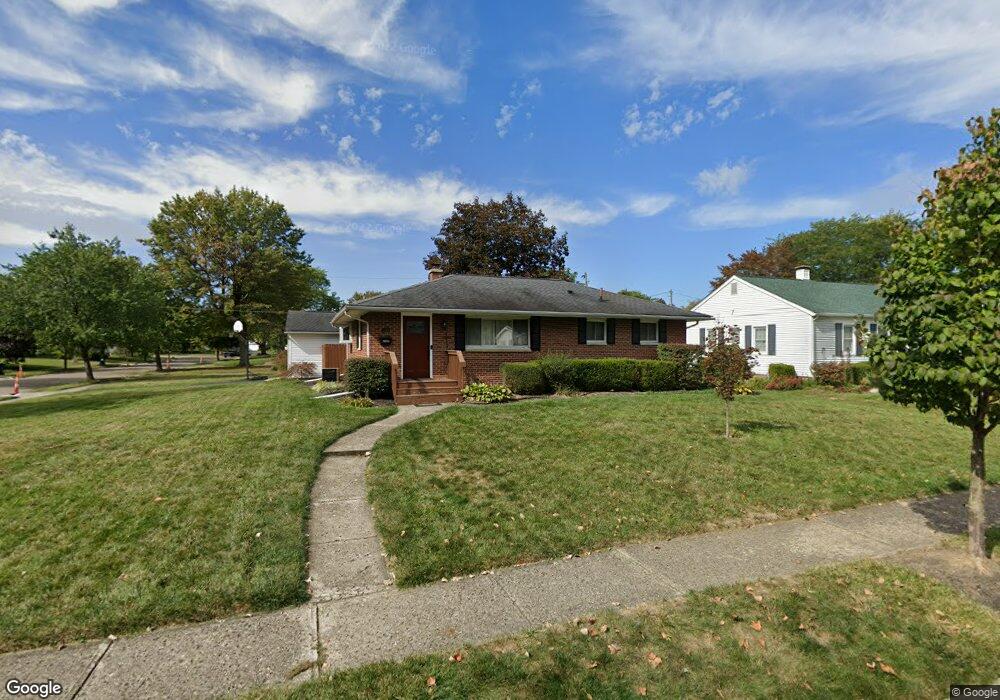
3791 Outer St Hilliard, OH 43026
Estimated Value: $281,634 - $314,000
3
Beds
1
Bath
1,089
Sq Ft
$271/Sq Ft
Est. Value
About This Home
This home is located at 3791 Outer St, Hilliard, OH 43026 and is currently estimated at $294,659, approximately $270 per square foot. 3791 Outer St is a home located in Franklin County with nearby schools including J W Reason Elementary School, Hilliard Station Sixth Grade Elementary School, and Hilliard Heritage Middle School.
Ownership History
Date
Name
Owned For
Owner Type
Purchase Details
Closed on
May 9, 2023
Sold by
Gross Angela
Bought by
Gross Ryan
Current Estimated Value
Purchase Details
Closed on
Jan 29, 2022
Sold by
Gross Angela
Bought by
Gross Ryan
Purchase Details
Closed on
Apr 17, 2006
Sold by
Humphrey Mandy J and Humphrey Tim S
Bought by
Gross Ryan and Gould Angela
Home Financials for this Owner
Home Financials are based on the most recent Mortgage that was taken out on this home.
Original Mortgage
$145,500
Interest Rate
6.42%
Mortgage Type
Fannie Mae Freddie Mac
Purchase Details
Closed on
Jun 26, 1996
Sold by
Knicely Gwendolyn I
Bought by
Humphrey Tim S and Humphrey Mandy J
Home Financials for this Owner
Home Financials are based on the most recent Mortgage that was taken out on this home.
Original Mortgage
$81,700
Interest Rate
8.13%
Mortgage Type
New Conventional
Create a Home Valuation Report for This Property
The Home Valuation Report is an in-depth analysis detailing your home's value as well as a comparison with similar homes in the area
Home Values in the Area
Average Home Value in this Area
Purchase History
| Date | Buyer | Sale Price | Title Company |
|---|---|---|---|
| Gross Ryan | -- | None Listed On Document | |
| Gross Ryan | -- | None Listed On Document | |
| Gross Ryan | $150,000 | Title First | |
| Humphrey Tim S | $86,000 | -- |
Source: Public Records
Mortgage History
| Date | Status | Borrower | Loan Amount |
|---|---|---|---|
| Previous Owner | Gross Ryan | $145,500 | |
| Previous Owner | Humphrey Tim S | $81,700 |
Source: Public Records
Tax History Compared to Growth
Tax History
| Year | Tax Paid | Tax Assessment Tax Assessment Total Assessment is a certain percentage of the fair market value that is determined by local assessors to be the total taxable value of land and additions on the property. | Land | Improvement |
|---|---|---|---|---|
| 2024 | $5,336 | $79,670 | $29,440 | $50,230 |
| 2023 | $4,345 | $79,670 | $29,440 | $50,230 |
| 2022 | $4,023 | $58,700 | $18,800 | $39,900 |
| 2021 | $4,333 | $58,700 | $18,800 | $39,900 |
| 2020 | $4,010 | $58,700 | $18,800 | $39,900 |
| 2019 | $3,722 | $42,670 | $13,930 | $28,740 |
| 2018 | $3,637 | $42,670 | $13,930 | $28,740 |
| 2017 | $3,746 | $42,670 | $13,930 | $28,740 |
| 2016 | $3,931 | $45,510 | $13,620 | $31,890 |
| 2015 | $3,713 | $45,510 | $13,620 | $31,890 |
| 2014 | $3,719 | $45,510 | $13,620 | $31,890 |
| 2013 | $1,887 | $45,500 | $13,615 | $31,885 |
Source: Public Records
Map
Nearby Homes
- 1774 Zucchina Dr
- 4695 Cemetery Rd
- 3643 Carriage Run Dr
- 4863 Berry Leaf Place
- 4967 Carroll Ct
- 4933 Travers Ct
- 3661 Patty Ln
- 5137 Drivemere Rd
- 5155 Drivemere Rd
- 5175 Wyandot Place
- 3416 Leap Rd
- 5126 Bigelow Dr
- 5220 Conklin Dr
- 5258 Scioto Darby Rd
- 5190 Bigelow Dr
- 5251 Bigelow Dr
- 3267 Scioto Farms Dr
- 3255 Reed Point Dr
- 5293 Williamsburg Cir
- 5215 Morning Cir
- 3799 Outer St
- 4790 Midlane Dr
- 4796 Midlane Dr
- 3813 Outer St
- 4789 Hillcrest St N
- 4775 Midlane Dr
- 4783 Midlane Dr
- 3796 Outer St
- 4767 Midlane Dr
- 4793 Midlane Dr
- 3808 Outer St
- 4791 Hillcrest St N
- 4806 Midlane Dr
- 4801 Midlane Dr
- 4755 Midlane Dr
- 3814 Outer St
- 4805 Hillcrest St N
- 4807 Midlane Dr
- 4812 Midlane Dr
- 4747 Midlane Dr