Estimated Value: $560,239 - $610,000
4
Beds
3
Baths
2,254
Sq Ft
$257/Sq Ft
Est. Value
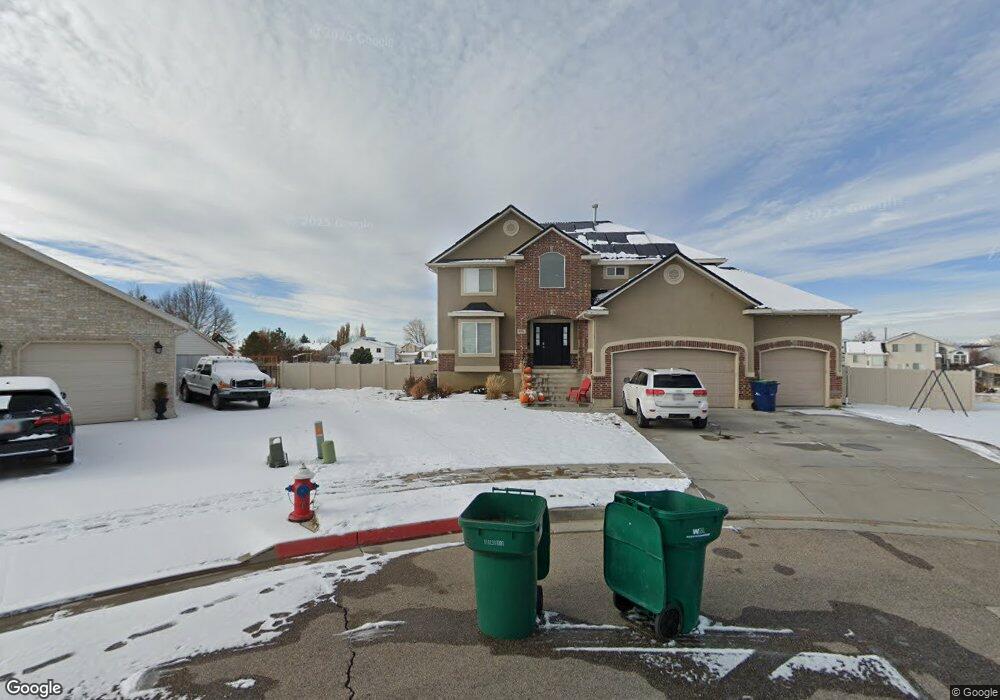
About This Home
This home is located at 3791 W 5300 S, Roy, UT 84067 and is currently estimated at $579,310, approximately $257 per square foot. 3791 W 5300 S is a home located in Weber County with nearby schools including Freedom School, Roy Junior High School, and Roy High School.
Ownership History
Date
Name
Owned For
Owner Type
Purchase Details
Closed on
Nov 26, 2004
Sold by
Boss Homes Llc
Bought by
Flint Travis J and Flint Angie D
Current Estimated Value
Home Financials for this Owner
Home Financials are based on the most recent Mortgage that was taken out on this home.
Original Mortgage
$224,000
Outstanding Balance
$100,991
Interest Rate
4.25%
Mortgage Type
Purchase Money Mortgage
Estimated Equity
$478,319
Purchase Details
Closed on
Feb 18, 2004
Sold by
R & K Development Llc
Bought by
Boss Homes Llc and Flint Travis J
Home Financials for this Owner
Home Financials are based on the most recent Mortgage that was taken out on this home.
Original Mortgage
$212,101
Interest Rate
5.85%
Mortgage Type
Purchase Money Mortgage
Purchase Details
Closed on
Dec 18, 2003
Sold by
R & K Development Llc
Bought by
R & K Development Llc
Purchase Details
Closed on
Dec 10, 2003
Sold by
Ivins Kevin
Bought by
R & K Development Llc
Create a Home Valuation Report for This Property
The Home Valuation Report is an in-depth analysis detailing your home's value as well as a comparison with similar homes in the area
Home Values in the Area
Average Home Value in this Area
Purchase History
| Date | Buyer | Sale Price | Title Company |
|---|---|---|---|
| Flint Travis J | -- | Mountain View Title | |
| Boss Homes Llc | -- | -- | |
| R & K Development Llc | -- | -- | |
| R & K Development Llc | -- | -- |
Source: Public Records
Mortgage History
| Date | Status | Borrower | Loan Amount |
|---|---|---|---|
| Open | Flint Travis J | $224,000 | |
| Previous Owner | Boss Homes Llc | $212,101 |
Source: Public Records
Tax History
| Year | Tax Paid | Tax Assessment Tax Assessment Total Assessment is a certain percentage of the fair market value that is determined by local assessors to be the total taxable value of land and additions on the property. | Land | Improvement |
|---|---|---|---|---|
| 2025 | $3,678 | $597,971 | $189,158 | $408,813 |
| 2024 | $3,591 | $323,399 | $104,036 | $219,363 |
| 2023 | $3,750 | $340,450 | $99,128 | $241,322 |
| 2022 | $3,624 | $336,050 | $76,085 | $259,965 |
| 2021 | $2,916 | $444,000 | $91,052 | $352,948 |
| 2020 | $2,748 | $384,000 | $91,052 | $292,948 |
| 2019 | $2,629 | $346,000 | $73,499 | $272,501 |
| 2018 | $2,521 | $313,000 | $63,426 | $249,574 |
| 2017 | $2,363 | $275,000 | $60,412 | $214,588 |
| 2016 | $2,217 | $138,597 | $31,783 | $106,814 |
| 2015 | $2,021 | $129,258 | $24,902 | $104,356 |
| 2014 | $2,009 | $127,176 | $24,902 | $102,274 |
Source: Public Records
Map
Nearby Homes
- 5412 S 3925 W
- 5444 S 4050 W
- 4096 W 5075 S
- 3832 W 5625 S
- 3443 W 5200 S Unit 2&3
- 4088 W 5050 S
- 4216 W 5250 S
- 4239 W 5325 S
- 4950 3900 West St
- 4218 W 5050 S
- 3826 W 5750 S
- 4277 W 5250 S
- 4813 S 3850 W
- 3509 W 4835 S Unit 26
- 3517 W 4835 S Unit 27
- 5773 S 3850 W
- 5035 S 4275 W
- 5856 S 3950 W
- 3937 W 4650 S
- 5155 S 3200 W
- 3791 W 5300 S Unit 39
- 3779 W 5300 S
- 3779 W 5300 S Unit 38
- 3790 W 5300 S Unit 40
- 3790 W 5300 S
- 3767 W 5300 S
- 3767 W 5300 S Unit 37
- 5212 Vista Dr
- 5254 Vista Dr
- 5176 Vista Dr
- 5288 Vista Dr
- 5176 S 3875 W
- 5138 Vista Dr
- 3755 W 5300 S
- 3755 W 5300 S Unit 36
- 3766 W 5300 S
- 3766 W 5300 S Unit 41
- 3766 W 5300 S Unit 41
- 5326 Vista Dr
- 5326 Vista Dr Unit 28
Your Personal Tour Guide
Ask me questions while you tour the home.