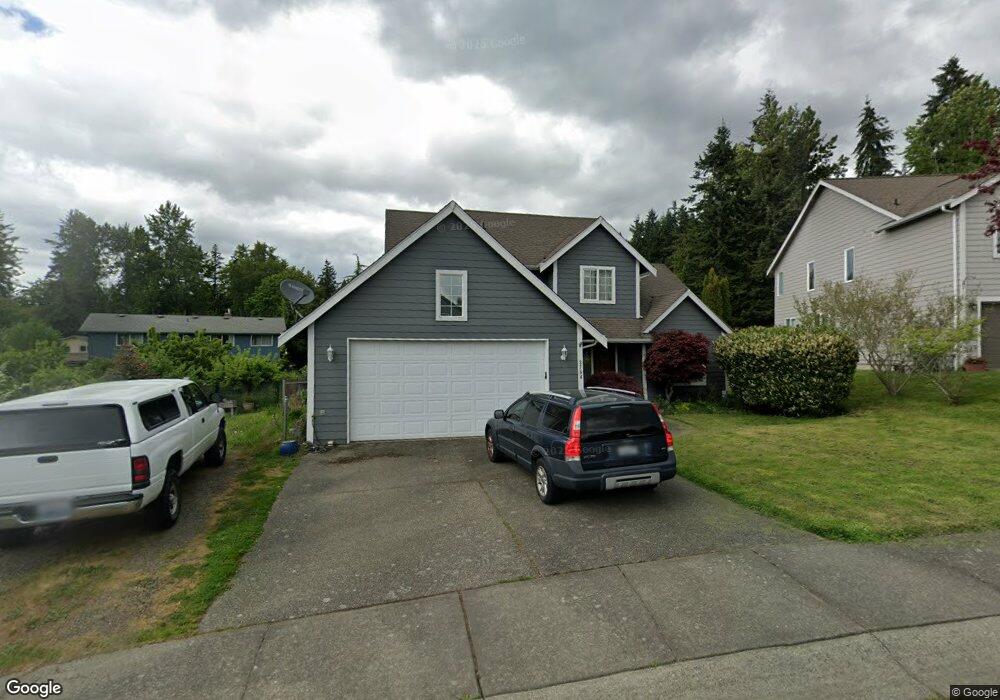
3794 Megan Ln Bellingham, WA 98226
Estimated Value: $709,000 - $866,000
3
Beds
3
Baths
2,065
Sq Ft
$385/Sq Ft
Est. Value
About This Home
This home is located at 3794 Megan Ln, Bellingham, WA 98226 and is currently estimated at $794,190, approximately $384 per square foot. 3794 Megan Ln is a home located in Whatcom County with nearby schools including Northern Heights Elementary School, Shuksan Middle School, and Squalicum High School.
Ownership History
Date
Name
Owned For
Owner Type
Purchase Details
Closed on
Mar 16, 2009
Sold by
Funk Maryanne
Bought by
Funk Rodger
Current Estimated Value
Home Financials for this Owner
Home Financials are based on the most recent Mortgage that was taken out on this home.
Original Mortgage
$241,000
Outstanding Balance
$153,730
Interest Rate
5.19%
Mortgage Type
Purchase Money Mortgage
Estimated Equity
$640,460
Purchase Details
Closed on
Aug 29, 2001
Sold by
Funk Caryn
Bought by
Funk Rodger
Home Financials for this Owner
Home Financials are based on the most recent Mortgage that was taken out on this home.
Original Mortgage
$171,000
Interest Rate
7.05%
Purchase Details
Closed on
May 9, 2000
Sold by
Myers General Inc
Bought by
Funk Rodger and Funk Caryn
Home Financials for this Owner
Home Financials are based on the most recent Mortgage that was taken out on this home.
Original Mortgage
$171,650
Interest Rate
8.22%
Create a Home Valuation Report for This Property
The Home Valuation Report is an in-depth analysis detailing your home's value as well as a comparison with similar homes in the area
Home Values in the Area
Average Home Value in this Area
Purchase History
| Date | Buyer | Sale Price | Title Company |
|---|---|---|---|
| Funk Rodger | -- | Chicago Title Insurance | |
| Funk Rodger | -- | Charter Title Corporation | |
| Funk Rodger | $152,140 | Whatcom Land Title |
Source: Public Records
Mortgage History
| Date | Status | Borrower | Loan Amount |
|---|---|---|---|
| Open | Funk Rodger | $241,000 | |
| Previous Owner | Funk Rodger | $171,000 | |
| Previous Owner | Funk Rodger | $171,650 |
Source: Public Records
Tax History Compared to Growth
Tax History
| Year | Tax Paid | Tax Assessment Tax Assessment Total Assessment is a certain percentage of the fair market value that is determined by local assessors to be the total taxable value of land and additions on the property. | Land | Improvement |
|---|---|---|---|---|
| 2024 | $5,792 | $642,093 | $228,096 | $413,997 |
| 2023 | $5,792 | $670,333 | $238,128 | $432,205 |
| 2022 | $4,622 | $544,986 | $193,600 | $351,386 |
| 2021 | $4,503 | $450,402 | $160,000 | $290,402 |
| 2020 | $4,323 | $412,229 | $143,308 | $268,921 |
| 2019 | $3,783 | $385,155 | $133,998 | $251,157 |
| 2018 | $3,922 | $345,459 | $120,198 | $225,261 |
| 2017 | $3,415 | $305,665 | $106,352 | $199,313 |
| 2016 | $3,155 | $277,797 | $96,784 | $181,013 |
| 2015 | $3,487 | $264,640 | $92,000 | $172,640 |
| 2014 | -- | $284,476 | $92,880 | $191,596 |
| 2013 | -- | $272,428 | $90,000 | $182,428 |
Source: Public Records
Map
Nearby Homes
- 1580 Hillsdale Rd
- 3871 Cindy Ln
- 3785 Greenville Place
- 3666 Woodlake Rd
- 1430 Welling Rd
- 2933 Toad Lake Rd
- 1379 Northwood Ct
- 1812 Squalicum Mountain Rd
- 4431 Alice St
- 1368 Roma Rd
- 4414 Alice St
- 4055 Springland Ct
- 1314 Welling Rd
- 4121 Malachite Dr
- 4136 Malachite Dr
- 1756 Emerald Lake Way
- 1668 Sapphire Trail
- 4020 Academy St
- 1 XXX Sleepy Hollow Ln
- 4220 Brays Way