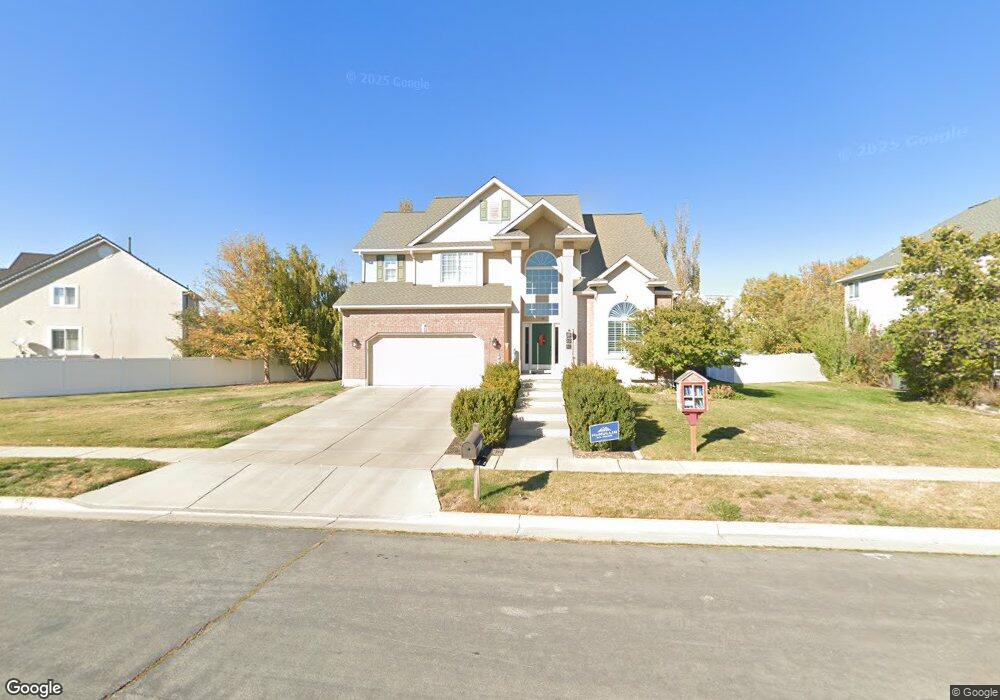
3796 Cherry Hills Cir Syracuse, UT 84075
Estimated Value: $542,000 - $610,955
4
Beds
3
Baths
2,253
Sq Ft
$258/Sq Ft
Est. Value
About This Home
This home is located at 3796 Cherry Hills Cir, Syracuse, UT 84075 and is currently estimated at $581,489, approximately $258 per square foot. 3796 Cherry Hills Cir is a home located in Davis County with nearby schools including Buffalo Point School, Syracuse Junior High School, and Syracuse High School.
Ownership History
Date
Name
Owned For
Owner Type
Purchase Details
Closed on
Feb 13, 2020
Sold by
Stringham Robyn O and The Robyn O Stringham Revocabl
Bought by
Stringham Dell Scott and Stringham Robyn O
Current Estimated Value
Purchase Details
Closed on
Jan 26, 2006
Sold by
Stringham Dell S and Stringham Robyn O
Bought by
Stringham Robyn O
Purchase Details
Closed on
Jun 25, 2003
Sold by
Stringham Dell Scott and Stringham Robyn O
Bought by
Stringham Dell S and Stringham Robyn O
Home Financials for this Owner
Home Financials are based on the most recent Mortgage that was taken out on this home.
Original Mortgage
$184,500
Interest Rate
4.76%
Mortgage Type
Purchase Money Mortgage
Purchase Details
Closed on
Nov 12, 1997
Sold by
Blackburn Jones Real Estate Inc
Bought by
Stringham Dell Scott and Stringham Robyn O
Home Financials for this Owner
Home Financials are based on the most recent Mortgage that was taken out on this home.
Original Mortgage
$176,800
Interest Rate
7.3%
Mortgage Type
Construction
Create a Home Valuation Report for This Property
The Home Valuation Report is an in-depth analysis detailing your home's value as well as a comparison with similar homes in the area
Home Values in the Area
Average Home Value in this Area
Purchase History
| Date | Buyer | Sale Price | Title Company |
|---|---|---|---|
| Stringham Dell Scott | -- | None Available | |
| Stringham Robyn O | -- | None Available | |
| Stringham Dell S | -- | Backman Stewart Title Servic | |
| Stringham Dell Scott | -- | Associated Title Company |
Source: Public Records
Mortgage History
| Date | Status | Borrower | Loan Amount |
|---|---|---|---|
| Closed | Stringham Dell S | $184,500 | |
| Closed | Stringham Dell Scott | $176,800 |
Source: Public Records
Tax History
| Year | Tax Paid | Tax Assessment Tax Assessment Total Assessment is a certain percentage of the fair market value that is determined by local assessors to be the total taxable value of land and additions on the property. | Land | Improvement |
|---|---|---|---|---|
| 2025 | $3,016 | $290,950 | $110,779 | $180,171 |
| 2024 | $2,888 | $280,500 | $89,833 | $190,667 |
| 2023 | $2,797 | $495,000 | $135,006 | $359,994 |
| 2022 | $2,982 | $289,300 | $68,384 | $220,916 |
| 2021 | $2,517 | $378,000 | $99,605 | $278,395 |
| 2020 | $2,228 | $324,000 | $81,126 | $242,874 |
| 2019 | $2,173 | $312,000 | $84,548 | $227,452 |
| 2018 | $2,014 | $287,000 | $81,994 | $205,006 |
| 2016 | $1,858 | $138,821 | $33,919 | $104,902 |
| 2015 | $1,837 | $130,736 | $33,919 | $96,817 |
| 2014 | $1,821 | $132,087 | $33,919 | $98,168 |
| 2013 | -- | $129,595 | $31,653 | $97,942 |
Source: Public Records
Map
Nearby Homes
- 3736 W 1225 S
- 3867 Rungsted Cir
- 3546 Brookshire Dr
- 1430 Heather Ln
- 1340 S 4125 W
- 4068 W 1200 S
- 1829 S 3525 W
- 4193 W 1175 S
- 3971 W 975 S
- 1302 S 4350 W
- 1157 S 4425 W
- 1155 S 4475 W
- 1139 S 4475 W
- 1068 S 4425 W
- 1144 S 4475 W
- 1126 S 4475 W
- 4411 W 920 S Unit 111
- 2982 S 3000 W
- 2912 S 3000 W
- 982 S 4475 W Unit 122
- 3822 Cherry Hills Cir
- 3776 Cherry Hills Cir
- 0 Cherry Hills Cir S
- 3801 W Formby Dr
- 3801 Formby Cir
- 3793 Formby Cir
- 3793 Cherry Hills Cir
- 3793 Cherry Hills Cir S
- 3811 Cherry Hills Cir
- 3811 Cherry Hills Cir S
- 3773 Cherry Hills Cir
- 3762 Cherry Hills Cir
- 1483 Prestwick Dr
- 3787 Formby Cir
- 3825 Cherry Hills Cir
- 3825 Cherry Hills Cir Unit 111
- 3787 W Formby Dr
- 3843 Formby Dr
- 3798 W Formby Dr S
- 3756 Cherry Hills Cir
Your Personal Tour Guide
Ask me questions while you tour the home.