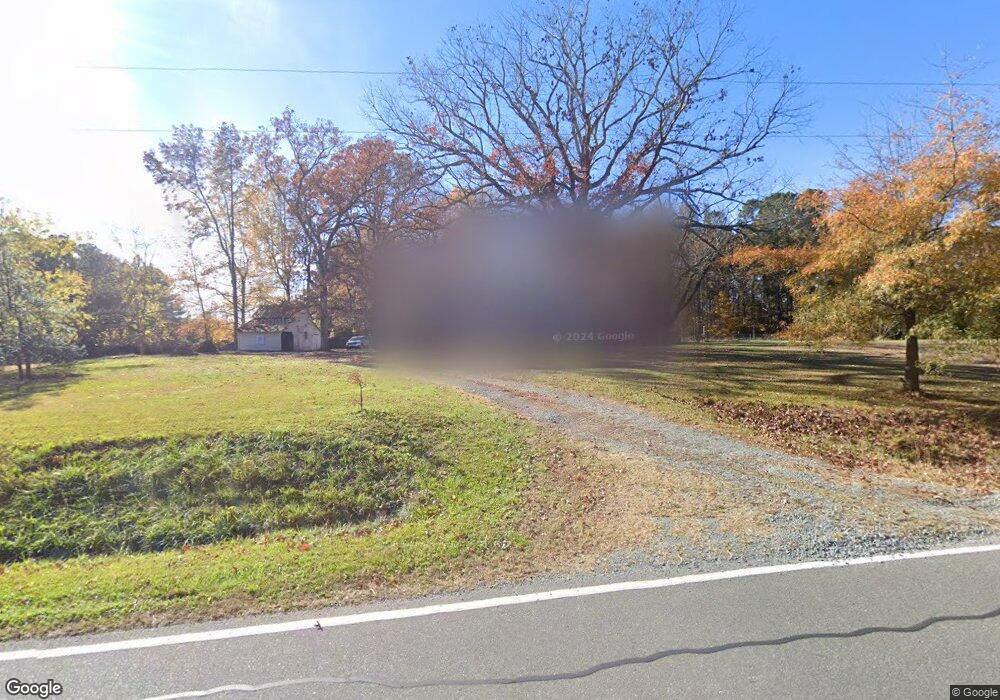
3797 Crawford Dairy Rd Chapel Hill, NC 27516
Estimated Value: $347,000 - $780,000
2
Beds
1
Bath
2,365
Sq Ft
$240/Sq Ft
Est. Value
About This Home
This home is located at 3797 Crawford Dairy Rd, Chapel Hill, NC 27516 and is currently estimated at $566,818, approximately $239 per square foot. 3797 Crawford Dairy Rd is a home located in Chatham County with nearby schools including Perry W. Harrison Elementary School, Margaret B. Pollard Middle School, and Northwood High.
Ownership History
Date
Name
Owned For
Owner Type
Purchase Details
Closed on
Jul 2, 2025
Sold by
Defranceschi Gabrielle
Bought by
Defranceschi-Minor Family Trust and Defranceschi
Current Estimated Value
Purchase Details
Closed on
Jul 15, 2020
Sold by
Nowicki Salvatore John and Workman Gregory A
Bought by
Defranchi Gabrielle
Home Financials for this Owner
Home Financials are based on the most recent Mortgage that was taken out on this home.
Original Mortgage
$360,900
Interest Rate
3.1%
Mortgage Type
New Conventional
Purchase Details
Closed on
May 11, 2012
Sold by
Heatherley Elizabeth A and Kirk Lila H
Bought by
Nowicki Salvatore John and Workman Gregory A
Home Financials for this Owner
Home Financials are based on the most recent Mortgage that was taken out on this home.
Original Mortgage
$233,871
Interest Rate
3.91%
Mortgage Type
FHA
Create a Home Valuation Report for This Property
The Home Valuation Report is an in-depth analysis detailing your home's value as well as a comparison with similar homes in the area
Home Values in the Area
Average Home Value in this Area
Purchase History
| Date | Buyer | Sale Price | Title Company |
|---|---|---|---|
| Defranceschi-Minor Family Trust | -- | None Listed On Document | |
| Defranchi Gabrielle | $401,000 | None Available | |
| Nowicki Salvatore John | $150,000 | None Available |
Source: Public Records
Mortgage History
| Date | Status | Borrower | Loan Amount |
|---|---|---|---|
| Previous Owner | Defranchi Gabrielle | $360,900 | |
| Previous Owner | Nowicki Salvatore John | $233,871 |
Source: Public Records
Tax History Compared to Growth
Tax History
| Year | Tax Paid | Tax Assessment Tax Assessment Total Assessment is a certain percentage of the fair market value that is determined by local assessors to be the total taxable value of land and additions on the property. | Land | Improvement |
|---|---|---|---|---|
| 2025 | $3,273 | $443,831 | $161,418 | $282,413 |
| 2024 | $3,273 | $300,601 | $128,870 | $171,731 |
| 2023 | $2,701 | $300,601 | $128,870 | $171,731 |
| 2022 | $2,479 | $300,601 | $128,870 | $171,731 |
| 2021 | $2,449 | $300,601 | $128,870 | $171,731 |
| 2020 | $1,750 | $208,826 | $112,348 | $96,478 |
| 2019 | $1,750 | $208,826 | $112,348 | $96,478 |
| 2018 | $1,618 | $208,826 | $112,348 | $96,478 |
| 2017 | $1,652 | $208,826 | $112,348 | $96,478 |
| 2016 | $1,588 | $198,613 | $102,135 | $96,478 |
| 2015 | $1,565 | $198,613 | $102,135 | $96,478 |
| 2014 | $1,501 | $198,613 | $102,135 | $96,478 |
| 2013 | -- | $198,613 | $102,135 | $96,478 |
Source: Public Records
Map
Nearby Homes
- 000 Windsor Rd
- 46 Chetango Mountain Rd
- 884 Windsor Rd
- 7117 New Light Trail
- 1487 Collins Mountain Rd
- 0 Crawford Dairy Rd Unit 10090315
- 279 Box Turtle Trail
- 9402 N Carolina 87
- 1725 Wildcat Ln
- 8450 Perry Rd
- 4322 Russell Rd
- 97 Fox Oak Trail
- Tract C Chicken Bridge Rd
- Tract B Chicken Bridge Rd
- Tract A Chicken Bridge Rd
- 2039 Elkins Ln
- 1018 Terrell Woods Ln
- 00 Bowman Bare Rd
- 4058 Whispering Oaks Ct
- 4604 Hopewood Dr
- 3797 Crawford Dairy Rd
- 3867 Crawford Dairy Rd
- 3905 Crawford Dairy Rd
- 3694 Crawford Dairy Rd
- 4056 Crawford Dairy Rd
- 3930 Crawford Dairy Rd
- 0 Crawford Dairy Rd
- TBD (XL) Crawford Dairy Rd
- TBD(S) Crawford Dairy Rd
- 00 Crawford Dairy Rd
- 4058 Crawford Dairy Rd
- 3548 Crawford Dairy Rd
- 4085 Crawford Dairy Rd
- 239 Windsor Rd
- 4125 Crawford Dairy Rd
- 4125 Crawford Dairy Rd
- 433 Deer Path
- 291 Deer Path
- 251 Deer Path
- 251 Deer Path