37977 3rd St Fremont, CA 94536
Niles NeighborhoodEstimated Value: $881,949 - $1,678,000
About This Home
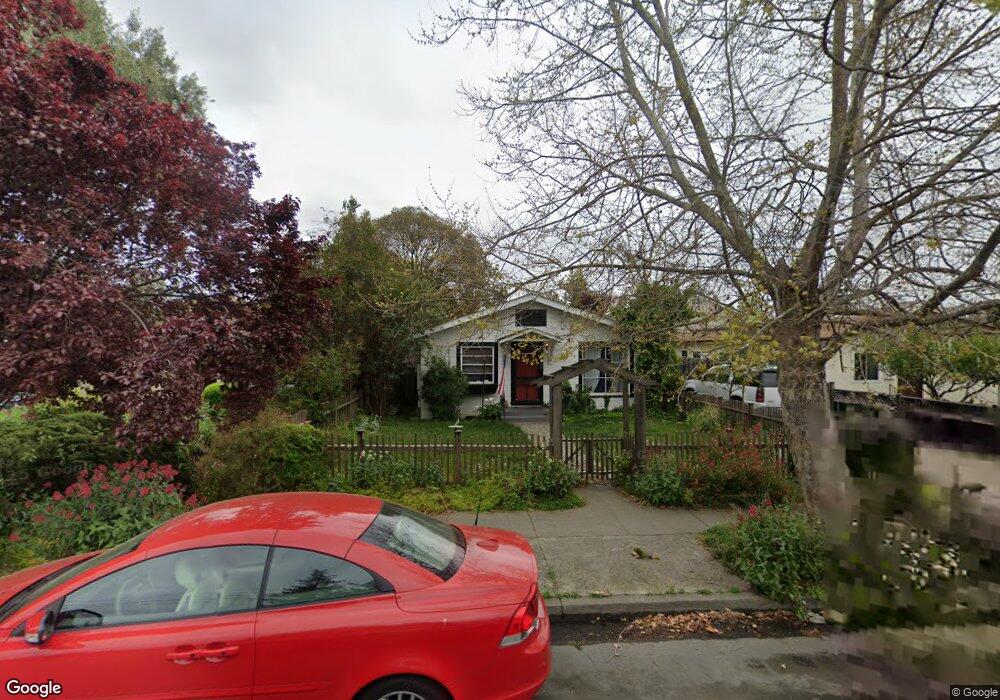
This home is located at 37977 3rd St, Fremont, CA 94536 and is currently estimated at $1,279,987, approximately $923 per square foot. 37977 3rd St is a home located in Alameda County with nearby schools including Niles Elementary School, Centerville Junior High School, and Washington High School.
Ownership History
We collect this data history from publicly available records. To have your information removed, we recommend requesting removal directly through your county’s website.
Purchase Details
Home Financials for this Owner
Home Financials are based on the most recent Mortgage that was taken out on this home.Home Values in the Area
Average Home Value in this Area
Purchase History
We collect this data history from publicly available records. To have your information removed, we recommend requesting removal directly through your county’s website.
| Date | Buyer | Sale Price | Title Company |
|---|---|---|---|
| $325,000 | Ticor Title Company Of Ca |
Mortgage History
We collect this data history from publicly available records. To have your information removed, we recommend requesting removal directly through your county’s website.
| Date | Status | Borrower | Loan Amount |
|---|---|---|---|
| Open | $260,000 | ||
| Closed | $32,500 |
Tax History
We collect this data history from publicly available records. To have your information removed, we recommend requesting removal directly through your county’s website.
| Year | Tax Paid | Tax Assessment Tax Assessment Total Assessment is a certain percentage of the fair market value that is determined by local assessors to be the total taxable value of land and additions on the property. | Land | Improvement |
|---|---|---|---|---|
| 2025 | $5,521 | $371,126 | $116,757 | $261,369 |
| 2024 | $5,521 | $363,715 | $114,469 | $256,246 |
| 2023 | $5,337 | $363,445 | $112,224 | $251,221 |
| 2022 | $5,219 | $349,320 | $110,024 | $246,296 |
| 2021 | $5,106 | $342,335 | $107,867 | $241,468 |
| 2020 | $4,957 | $345,756 | $106,762 | $238,994 |
| 2019 | $4,906 | $338,977 | $104,669 | $234,308 |
| 2018 | $4,801 | $332,330 | $102,616 | $229,714 |
| 2017 | $4,677 | $325,813 | $100,604 | $225,209 |
| 2016 | $4,581 | $319,426 | $98,632 | $220,794 |
| 2015 | $4,511 | $314,627 | $97,150 | $217,477 |
| 2014 | $4,421 | $308,464 | $95,247 | $213,217 |
Map
- 37955 2nd St
- 37915 Essanay Place
- 337 I St
- 339 I St
- 159 Quincy Terrace
- 37286 3rd St
- 38555 Overacker Ave
- 711 Old Canyon Rd Unit 6
- 711 Old Canyon Rd Unit 69
- 38614 Royal Ann Common
- 585 Old Canyon Rd
- 38623 Cherry Ln Unit 221
- 38623 Cherry Ln Unit 148
- 38623 Cherry Ln Unit 123
- 38623 Cherry Ln Unit 152
- 38623 Cherry Ln Unit 128
- 1170 Bennett Ct
- 38625 Oliver Way
- 37409 Currant Terrace
- 38467 Timpanogas Cir
Ask me questions while you tour the home.