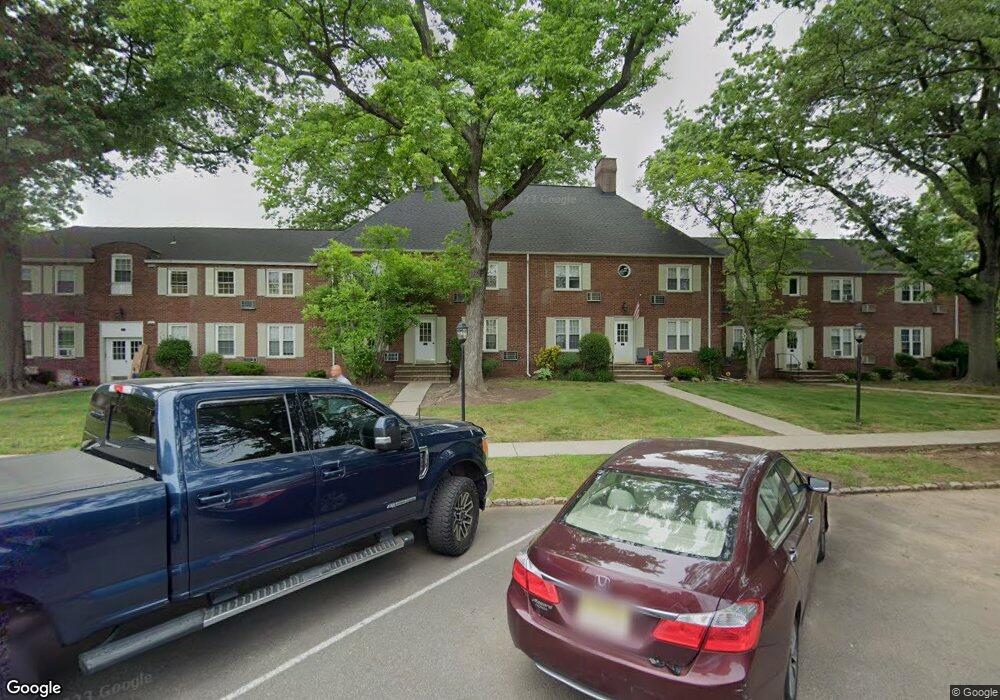
37A Parkway Village Unit 37A Cranford, NJ 07016
Estimated Value: $288,000 - $373,000
--
Bed
--
Bath
855
Sq Ft
$404/Sq Ft
Est. Value
About This Home
This home is located at 37A Parkway Village Unit 37A, Cranford, NJ 07016 and is currently estimated at $345,743, approximately $404 per square foot. 37A Parkway Village Unit 37A is a home located in Union County with nearby schools including Cranford Sr High School, St Michael School, and St. Theresa School.
Ownership History
Date
Name
Owned For
Owner Type
Purchase Details
Closed on
Aug 27, 2020
Sold by
Hoyt Susan L
Bought by
Doneray Perrone Isil
Current Estimated Value
Home Financials for this Owner
Home Financials are based on the most recent Mortgage that was taken out on this home.
Original Mortgage
$232,750
Interest Rate
2.8%
Mortgage Type
New Conventional
Purchase Details
Closed on
Apr 3, 2001
Sold by
Vitale Mario
Bought by
Curley Nancy
Home Financials for this Owner
Home Financials are based on the most recent Mortgage that was taken out on this home.
Original Mortgage
$113,600
Interest Rate
6.88%
Mortgage Type
Stand Alone First
Purchase Details
Closed on
Aug 11, 1999
Sold by
Moran Anita R
Bought by
Vitale Mario A
Home Financials for this Owner
Home Financials are based on the most recent Mortgage that was taken out on this home.
Original Mortgage
$108,000
Interest Rate
7.6%
Mortgage Type
Purchase Money Mortgage
Create a Home Valuation Report for This Property
The Home Valuation Report is an in-depth analysis detailing your home's value as well as a comparison with similar homes in the area
Home Values in the Area
Average Home Value in this Area
Purchase History
| Date | Buyer | Sale Price | Title Company |
|---|---|---|---|
| Doneray Perrone Isil | $245,000 | Ats Title Agency | |
| Curley Nancy | $142,000 | Stewart Title Guaranty Compa | |
| Vitale Mario A | $120,000 | -- |
Source: Public Records
Mortgage History
| Date | Status | Borrower | Loan Amount |
|---|---|---|---|
| Previous Owner | Doneray Perrone Isil | $232,750 | |
| Previous Owner | Curley Nancy | $113,600 | |
| Previous Owner | Vitale Mario A | $108,000 |
Source: Public Records
Tax History Compared to Growth
Tax History
| Year | Tax Paid | Tax Assessment Tax Assessment Total Assessment is a certain percentage of the fair market value that is determined by local assessors to be the total taxable value of land and additions on the property. | Land | Improvement |
|---|---|---|---|---|
| 2025 | $5,267 | $77,700 | $28,600 | $49,100 |
| 2024 | $5,180 | $77,700 | $28,600 | $49,100 |
| 2023 | $5,180 | $77,700 | $28,600 | $49,100 |
| 2022 | $5,138 | $77,700 | $28,600 | $49,100 |
| 2021 | $5,115 | $77,700 | $28,600 | $49,100 |
| 2020 | $5,099 | $77,700 | $28,600 | $49,100 |
| 2019 | $5,066 | $77,700 | $28,600 | $49,100 |
| 2018 | $4,974 | $77,700 | $28,600 | $49,100 |
| 2017 | $4,803 | $77,700 | $28,600 | $49,100 |
| 2016 | $4,629 | $77,700 | $28,600 | $49,100 |
| 2015 | $4,507 | $77,700 | $28,600 | $49,100 |
| 2014 | $4,415 | $77,700 | $28,600 | $49,100 |
Source: Public Records
Map
Nearby Homes
- 30 Parkway Village Unit C
- 3 Parkway Village
- 515 Beechwood Ave
- 233 Cranford Ave
- 511 Westfield Ave W
- 628 Maplewood Ave
- 9 Lenox Ave
- 127 Bryant Ave
- 635 Bloomingdale Ave
- 14 Windsor Place
- 129 Thomas St
- 520 Chester Ave
- 657 Summit Ave
- 107 Myrtle St
- 323 Dermody St
- 457 W 4th Ave
- 611 Laurel Ave
- 826 Amsterdam Ave
- 219 Centennial Ave Unit B
- 18 Springfield Ave Unit 2D
- 38B Parkway Village
- 38A Parkway Village Unit 38A
- 38 Parkway Village Unit A
- 38 Parkway Village
- 37B Parkway Village Unit 37B
- 37 Parkway Village
- 39 Parkway Village Unit 39
- 36A Parkway Village
- 36B Parkway Village
- 36 Parkway Village
- 40 Parkway Village
- 40A Parkway Village
- 41 Parkway Village Unit 41B
- 41 Parkway Village Unit B
- 41 Parkway Village Unit A
- 41 Parkway Village Unit C
- 41 Parkway Village Unit D
- 41 Parkway Village
- 35 Parkway Village Unit D
- 35 Parkway Village Unit B