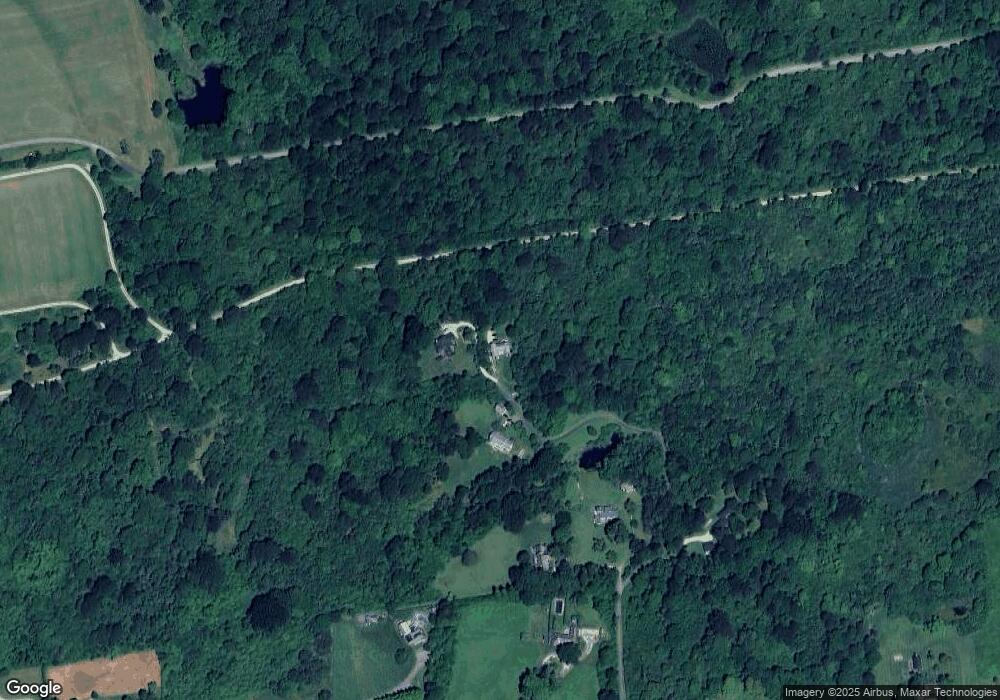
37C Taylors Ln Little Compton, RI 02837
Estimated Value: $2,383,437 - $2,854,000
4
Beds
5
Baths
3,004
Sq Ft
$903/Sq Ft
Est. Value
About This Home
This home is located at 37C Taylors Ln, Little Compton, RI 02837 and is currently estimated at $2,713,609, approximately $903 per square foot. 37C Taylors Ln is a home located in Newport County with nearby schools including Wilbur & McMahon School.
Ownership History
Date
Name
Owned For
Owner Type
Purchase Details
Closed on
Aug 11, 2021
Sold by
Murray Stephen S and Murray Sarah A
Bought by
Stephen S Murray T
Current Estimated Value
Purchase Details
Closed on
Jun 18, 2004
Sold by
Aldrich Peter and Aldrich Mary
Bought by
Murray Stephen and Murray Sarah
Create a Home Valuation Report for This Property
The Home Valuation Report is an in-depth analysis detailing your home's value as well as a comparison with similar homes in the area
Home Values in the Area
Average Home Value in this Area
Purchase History
| Date | Buyer | Sale Price | Title Company |
|---|---|---|---|
| Stephen S Murray T | -- | None Available | |
| Murray Stephen | $395,000 | -- |
Source: Public Records
Mortgage History
| Date | Status | Borrower | Loan Amount |
|---|---|---|---|
| Previous Owner | Murray Stephen | $350,000 | |
| Previous Owner | Murray Stephen | $385,000 | |
| Previous Owner | Murray Stephen | $100,000 | |
| Previous Owner | Murray Stephen | $389,000 |
Source: Public Records
Tax History Compared to Growth
Tax History
| Year | Tax Paid | Tax Assessment Tax Assessment Total Assessment is a certain percentage of the fair market value that is determined by local assessors to be the total taxable value of land and additions on the property. | Land | Improvement |
|---|---|---|---|---|
| 2025 | $11,013 | $2,299,200 | $788,900 | $1,510,300 |
| 2024 | $9,881 | $1,945,100 | $688,300 | $1,256,800 |
| 2023 | $9,648 | $1,945,100 | $688,300 | $1,256,800 |
| 2022 | $9,531 | $1,945,100 | $688,300 | $1,256,800 |
| 2021 | $9,835 | $1,628,300 | $559,800 | $1,068,500 |
| 2020 | $5,798 | $968,000 | $559,800 | $408,200 |
| 2019 | $5,137 | $866,300 | $559,800 | $306,500 |
| 2018 | $5,593 | $938,500 | $559,800 | $378,700 |
| 2016 | $5,321 | $938,500 | $559,800 | $378,700 |
| 2015 | $5,346 | $929,800 | $551,100 | $378,700 |
| 2014 | $5,244 | $929,800 | $551,100 | $378,700 |
Source: Public Records
Map
Nearby Homes