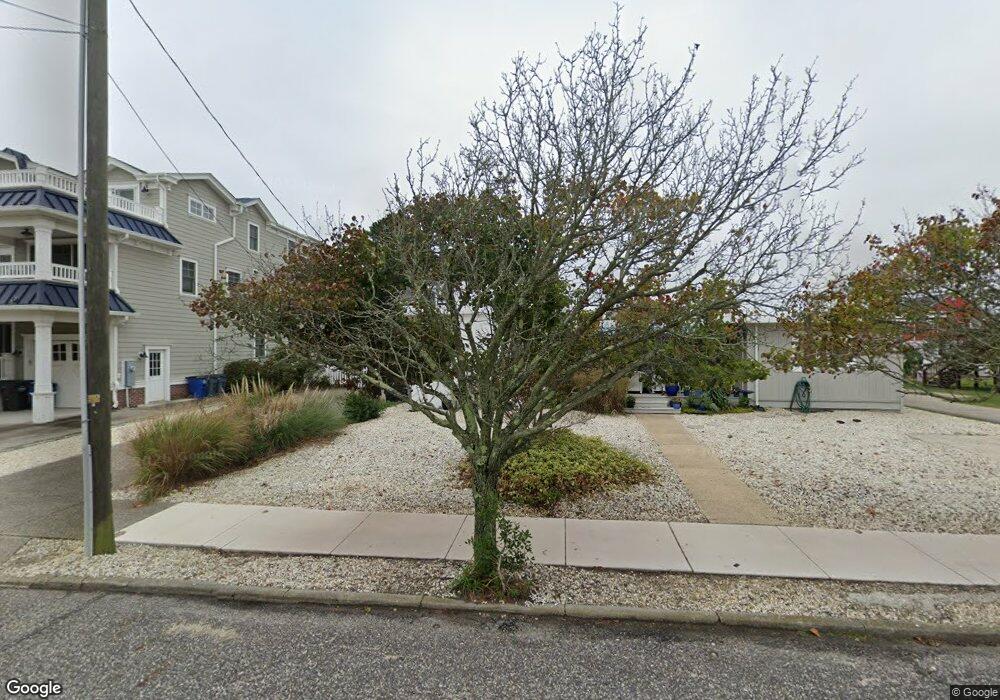
38 21st St W Avalon, NJ 08202
Estimated Value: $1,052,213 - $1,720,000
--
Bed
--
Bath
1,112
Sq Ft
$1,219/Sq Ft
Est. Value
About This Home
This home is located at 38 21st St W, Avalon, NJ 08202 and is currently estimated at $1,355,303, approximately $1,218 per square foot. 38 21st St W is a home located in Cape May County with nearby schools including Avalon Elementary School.
Ownership History
Date
Name
Owned For
Owner Type
Purchase Details
Closed on
Apr 26, 2014
Sold by
Moore James J and Moore Patricia G
Bought by
Keyser Brian
Current Estimated Value
Home Financials for this Owner
Home Financials are based on the most recent Mortgage that was taken out on this home.
Original Mortgage
$500,000
Outstanding Balance
$353,339
Interest Rate
2.5%
Mortgage Type
Adjustable Rate Mortgage/ARM
Estimated Equity
$1,001,964
Purchase Details
Closed on
Apr 19, 2004
Sold by
Perry Sondra
Bought by
Moore James J and Moore Patricia G
Home Financials for this Owner
Home Financials are based on the most recent Mortgage that was taken out on this home.
Original Mortgage
$520,000
Interest Rate
4.62%
Mortgage Type
Purchase Money Mortgage
Purchase Details
Closed on
Jul 14, 1989
Sold by
Kerr Elizabeth
Bought by
Mcgrath Mary and Mcgrath Mckernan,Mary
Create a Home Valuation Report for This Property
The Home Valuation Report is an in-depth analysis detailing your home's value as well as a comparison with similar homes in the area
Home Values in the Area
Average Home Value in this Area
Purchase History
| Date | Buyer | Sale Price | Title Company |
|---|---|---|---|
| Keyser Brian | $780,000 | Seaboard Title Agency | |
| Moore James J | $650,000 | First American Title Ins Co | |
| Mcgrath Mary | $215,000 | -- |
Source: Public Records
Mortgage History
| Date | Status | Borrower | Loan Amount |
|---|---|---|---|
| Open | Keyser Brian | $500,000 | |
| Previous Owner | Moore James J | $520,000 |
Source: Public Records
Tax History Compared to Growth
Tax History
| Year | Tax Paid | Tax Assessment Tax Assessment Total Assessment is a certain percentage of the fair market value that is determined by local assessors to be the total taxable value of land and additions on the property. | Land | Improvement |
|---|---|---|---|---|
| 2025 | $4,141 | $674,400 | $600,000 | $74,400 |
| 2024 | $4,141 | $674,400 | $600,000 | $74,400 |
| 2023 | $4,107 | $674,400 | $600,000 | $74,400 |
| 2022 | $3,831 | $674,400 | $600,000 | $74,400 |
| 2021 | $3,689 | $674,400 | $600,000 | $74,400 |
| 2020 | $3,547 | $674,400 | $600,000 | $74,400 |
| 2019 | $3,439 | $674,400 | $600,000 | $74,400 |
| 2018 | $3,291 | $674,400 | $600,000 | $74,400 |
| 2017 | $2,908 | $523,000 | $450,000 | $73,000 |
| 2016 | $2,877 | $523,000 | $450,000 | $73,000 |
| 2015 | $2,829 | $523,000 | $450,000 | $73,000 |
| 2014 | -- | $523,000 | $450,000 | $73,000 |
Source: Public Records
Map
Nearby Homes