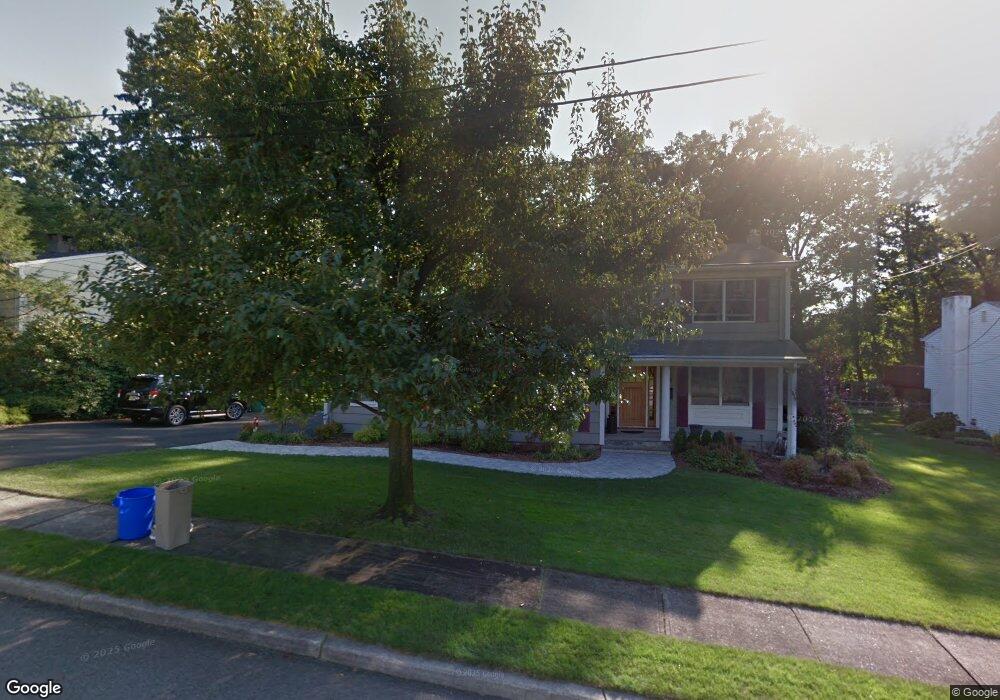
38 5th St Midland Park, NJ 07432
Estimated Value: $870,000 - $896,000
--
Bed
--
Bath
1,836
Sq Ft
$484/Sq Ft
Est. Value
About This Home
This home is located at 38 5th St, Midland Park, NJ 07432 and is currently estimated at $887,709, approximately $483 per square foot. 38 5th St is a home located in Bergen County with nearby schools including Godwin Elementary School, Highland Elementary School, and Midland Park Jr./Sr. High School.
Ownership History
Date
Name
Owned For
Owner Type
Purchase Details
Closed on
Jan 28, 2005
Sold by
Jacobellis Benedict
Bought by
Minicucci Nicholas and Minicucci Jennifer
Current Estimated Value
Home Financials for this Owner
Home Financials are based on the most recent Mortgage that was taken out on this home.
Original Mortgage
$464,000
Outstanding Balance
$235,534
Interest Rate
5.73%
Estimated Equity
$652,175
Create a Home Valuation Report for This Property
The Home Valuation Report is an in-depth analysis detailing your home's value as well as a comparison with similar homes in the area
Home Values in the Area
Average Home Value in this Area
Purchase History
| Date | Buyer | Sale Price | Title Company |
|---|---|---|---|
| Minicucci Nicholas | $580,000 | -- |
Source: Public Records
Mortgage History
| Date | Status | Borrower | Loan Amount |
|---|---|---|---|
| Open | Minicucci Nicholas | $464,000 |
Source: Public Records
Tax History Compared to Growth
Tax History
| Year | Tax Paid | Tax Assessment Tax Assessment Total Assessment is a certain percentage of the fair market value that is determined by local assessors to be the total taxable value of land and additions on the property. | Land | Improvement |
|---|---|---|---|---|
| 2025 | $16,259 | $467,200 | $249,000 | $218,200 |
| 2024 | $15,796 | $467,200 | $249,000 | $218,200 |
| 2023 | $15,193 | $467,200 | $249,000 | $218,200 |
| 2022 | $15,193 | $467,200 | $249,000 | $218,200 |
| 2021 | $14,212 | $467,200 | $249,000 | $218,200 |
| 2020 | $14,567 | $467,200 | $249,000 | $218,200 |
| 2019 | $14,212 | $467,200 | $249,000 | $218,200 |
| 2018 | $13,955 | $467,200 | $249,000 | $218,200 |
| 2017 | $13,722 | $467,200 | $249,000 | $218,200 |
| 2016 | $13,385 | $467,200 | $249,000 | $218,200 |
| 2015 | $13,133 | $467,200 | $249,000 | $218,200 |
| 2014 | $12,572 | $467,200 | $249,000 | $218,200 |
Source: Public Records
Map
Nearby Homes
- 108 Park Ave
- 53 W Summit Ave
- 29 Westview Terrace
- 260 Glen Ave
- 39 Payne Ave
- 20 van Schaik Ln
- 4 Elmwood Place
- 190 Madison Ave
- 137 Elmwood Place
- 279 Vreeland Ave
- 67 Hillside Ave
- 117 Spruce St
- 53 Smithfield Rd
- 111 Crescent Ave
- 36 Hemlock St
- 14 Pierce Ave
- 16 Butternut Ave
- 374 Cedar Hill Ave
- 406 Carriage Ln
- 352 Amherst St