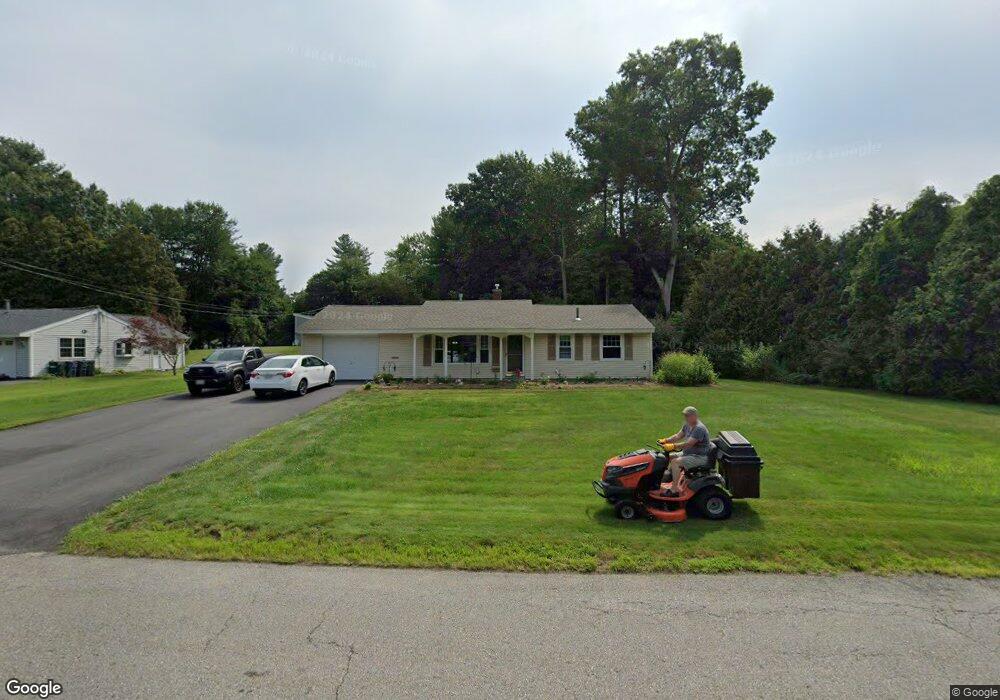
38 Algonquin Rd Chelmsford, MA 01824
Farms I NeighborhoodEstimated Value: $591,710 - $613,000
3
Beds
1
Bath
1,080
Sq Ft
$561/Sq Ft
Est. Value
About This Home
This home is located at 38 Algonquin Rd, Chelmsford, MA 01824 and is currently estimated at $605,678, approximately $560 per square foot. 38 Algonquin Rd is a home located in Middlesex County with nearby schools including South Row Elementary School, McCarthy Middle School, and Knowledge Beginnings South.
Ownership History
Date
Name
Owned For
Owner Type
Purchase Details
Closed on
Nov 12, 2024
Sold by
Gullage George F
Bought by
George Gullage Ret and Gullage
Current Estimated Value
Purchase Details
Closed on
Oct 30, 1995
Sold by
Est Beach Doris F and Beach David
Bought by
Cullage George and Cullage Susan
Home Financials for this Owner
Home Financials are based on the most recent Mortgage that was taken out on this home.
Original Mortgage
$100,000
Interest Rate
7.6%
Mortgage Type
Purchase Money Mortgage
Create a Home Valuation Report for This Property
The Home Valuation Report is an in-depth analysis detailing your home's value as well as a comparison with similar homes in the area
Home Values in the Area
Average Home Value in this Area
Purchase History
| Date | Buyer | Sale Price | Title Company |
|---|---|---|---|
| George Gullage Ret | -- | None Available | |
| George Gullage Ret | -- | None Available | |
| Cullage George | $140,000 | -- | |
| Cullage George | $140,000 | -- |
Source: Public Records
Mortgage History
| Date | Status | Borrower | Loan Amount |
|---|---|---|---|
| Previous Owner | Cullage George | $120,000 | |
| Previous Owner | Cullage George | $100,000 |
Source: Public Records
Tax History Compared to Growth
Tax History
| Year | Tax Paid | Tax Assessment Tax Assessment Total Assessment is a certain percentage of the fair market value that is determined by local assessors to be the total taxable value of land and additions on the property. | Land | Improvement |
|---|---|---|---|---|
| 2025 | $6,418 | $461,700 | $286,800 | $174,900 |
| 2024 | $6,238 | $458,000 | $286,800 | $171,200 |
| 2023 | $6,321 | $439,900 | $308,400 | $131,500 |
| 2022 | $6,139 | $389,300 | $264,200 | $125,100 |
| 2021 | $5,596 | $355,500 | $242,400 | $113,100 |
| 2020 | $5,586 | $339,600 | $208,900 | $130,700 |
| 2019 | $5,410 | $330,900 | $206,900 | $124,000 |
| 2018 | $5,523 | $307,500 | $186,400 | $121,100 |
| 2017 | $5,163 | $288,100 | $174,600 | $113,500 |
| 2016 | $5,057 | $280,500 | $178,800 | $101,700 |
| 2015 | $4,920 | $263,100 | $162,500 | $100,600 |
| 2014 | $4,747 | $250,100 | $153,400 | $96,700 |
Source: Public Records
Map
Nearby Homes
- 9 Donna Rd
- 10 Parlee Rd
- 6 Sierra Dr
- 12 Martin St
- 81 Bartlett St
- 216 Rangeway Rd Unit 192
- 66 Acton Rd
- Map29-14-1 Rangeway Rd
- 11 Simonds Farm Rd
- 3 Kay's Walk
- 15 Kay's Walk
- 1 Kay's Walk Unit 1
- 1 Kay's Walk
- 13 Kay's Walk
- 15 Kay's Walk Unit 4
- 3 Kay's Walk Unit 3
- 8 Kay's Walk Unit 13
- 14 Kay's Walk
- 6 Kay's Walk Unit 6
- 6 Kay's Walk