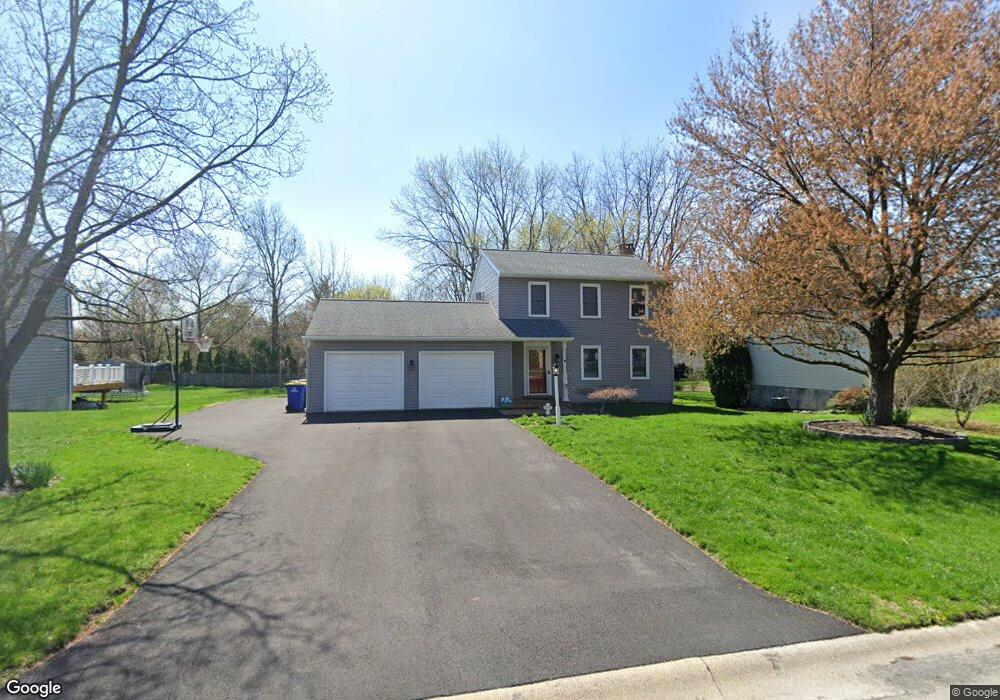
38 Allen Rd Ephrata, PA 17522
Brownstown NeighborhoodEstimated Value: $363,569 - $405,000
3
Beds
2
Baths
1,352
Sq Ft
$289/Sq Ft
Est. Value
About This Home
This home is located at 38 Allen Rd, Ephrata, PA 17522 and is currently estimated at $390,892, approximately $289 per square foot. 38 Allen Rd is a home located in Lancaster County with nearby schools including Brownstown El School, Gerald G. Huesken Middle School, and Conestoga Valley High School.
Ownership History
Date
Name
Owned For
Owner Type
Purchase Details
Closed on
Jul 14, 2011
Sold by
Fox Jerry D and Fox Janell B
Bought by
Fasnacht Adam R and Fasnacht Alicia M
Current Estimated Value
Home Financials for this Owner
Home Financials are based on the most recent Mortgage that was taken out on this home.
Original Mortgage
$205,172
Outstanding Balance
$141,019
Interest Rate
4.49%
Mortgage Type
New Conventional
Estimated Equity
$249,873
Purchase Details
Closed on
Oct 17, 2005
Sold by
Fox Jerry D and Fox Janell B
Bought by
Fox Jerry D and Fox Janell B
Create a Home Valuation Report for This Property
The Home Valuation Report is an in-depth analysis detailing your home's value as well as a comparison with similar homes in the area
Home Values in the Area
Average Home Value in this Area
Purchase History
| Date | Buyer | Sale Price | Title Company |
|---|---|---|---|
| Fasnacht Adam R | $198,000 | None Available | |
| Fox Jerry D | -- | None Available |
Source: Public Records
Mortgage History
| Date | Status | Borrower | Loan Amount |
|---|---|---|---|
| Open | Fasnacht Adam R | $205,172 |
Source: Public Records
Tax History Compared to Growth
Tax History
| Year | Tax Paid | Tax Assessment Tax Assessment Total Assessment is a certain percentage of the fair market value that is determined by local assessors to be the total taxable value of land and additions on the property. | Land | Improvement |
|---|---|---|---|---|
| 2025 | $3,475 | $174,600 | $55,500 | $119,100 |
| 2024 | $3,475 | $174,600 | $55,500 | $119,100 |
| 2023 | $3,394 | $174,600 | $55,500 | $119,100 |
| 2022 | $3,256 | $174,600 | $55,500 | $119,100 |
| 2021 | $3,138 | $174,600 | $55,500 | $119,100 |
| 2020 | $3,138 | $174,600 | $55,500 | $119,100 |
| 2019 | $3,068 | $174,600 | $55,500 | $119,100 |
| 2018 | $4,485 | $174,600 | $55,500 | $119,100 |
| 2017 | $2,875 | $135,300 | $39,100 | $96,200 |
| 2016 | $2,875 | $135,300 | $39,100 | $96,200 |
| 2015 | $720 | $135,300 | $39,100 | $96,200 |
| 2014 | $2,007 | $135,300 | $39,100 | $96,200 |
Source: Public Records
Map
Nearby Homes