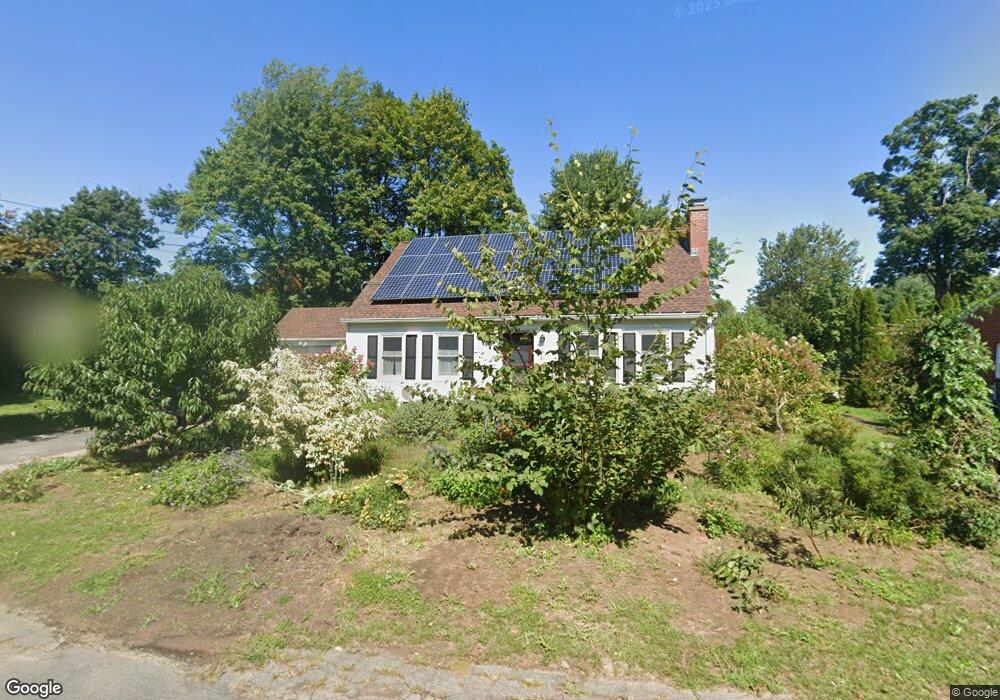
38 Allison St Northampton, MA 01060
Estimated Value: $593,000 - $668,000
About This Home
This home is located at 38 Allison St, Northampton, MA 01060 and is currently estimated at $637,013, approximately $488 per square foot. 38 Allison St is a home located in Hampshire County with nearby schools including Northampton High School, The Montessori School of Northampton, and Lander Grinspoon Academy.
Ownership History
We collect this data history from publicly available records. To have your information removed, we recommend requesting removal directly through your county’s website.
Purchase Details
Purchase Details
Home Values in the Area
Average Home Value in this Area
Purchase History
We collect this data history from publicly available records. To have your information removed, we recommend requesting removal directly through your county’s website.
| Date | Buyer | Sale Price | Title Company |
|---|---|---|---|
| -- | None Available | ||
| -- | None Available | ||
| $287,000 | -- | ||
| $287,000 | -- |
Mortgage History
We collect this data history from publicly available records. To have your information removed, we recommend requesting removal directly through your county’s website.
| Date | Status | Borrower | Loan Amount |
|---|---|---|---|
| Previous Owner | $140,000 | ||
| Previous Owner | $50,000 | ||
| Previous Owner | $48,000 |
Tax History
We collect this data history from publicly available records. To have your information removed, we recommend requesting removal directly through your county’s website.
| Year | Tax Paid | Tax Assessment Tax Assessment Total Assessment is a certain percentage of the fair market value that is determined by local assessors to be the total taxable value of land and additions on the property. | Land | Improvement |
|---|---|---|---|---|
| 2025 | $7,915 | $568,200 | $243,300 | $324,900 |
| 2024 | $7,158 | $471,200 | $221,200 | $250,000 |
| 2023 | $7,196 | $454,300 | $201,100 | $253,200 |
| 2022 | $6,392 | $357,300 | $188,000 | $169,300 |
| 2021 | $6,083 | $350,200 | $178,600 | $171,600 |
| 2020 | $5,883 | $350,200 | $178,600 | $171,600 |
| 2019 | $5,892 | $339,200 | $178,600 | $160,600 |
| 2018 | $5,865 | $344,200 | $178,600 | $165,600 |
| 2017 | $5,745 | $344,200 | $178,600 | $165,600 |
| 2016 | $5,562 | $344,200 | $178,600 | $165,600 |
| 2015 | $4,971 | $314,600 | $158,900 | $155,700 |
| 2014 | $4,842 | $314,600 | $158,900 | $155,700 |
Map
- 65 Blackberry Ln
- 162 Prospect Ave Unit 6
- 208 N Elm St
- 9 Khloe Ln
- 80 Damon Rd Unit 2303
- 80 Damon Rd Unit 8111
- 61 Woodlawn Ave
- 60 Massasoit St
- 43 Woodlawn Ave
- 15 Massasoit St
- 155 Prospect St
- 267 Locust St Unit 2L
- 14 Garfield St Unit A1
- 14 Garfield St Unit A2
- 0 N King St
- 37 Finn St
- 67 Milton St
- 26 Crescent St Unit G2
- 38 Round Hill Rd
- 114 S Main St
Ask me questions while you tour the home.