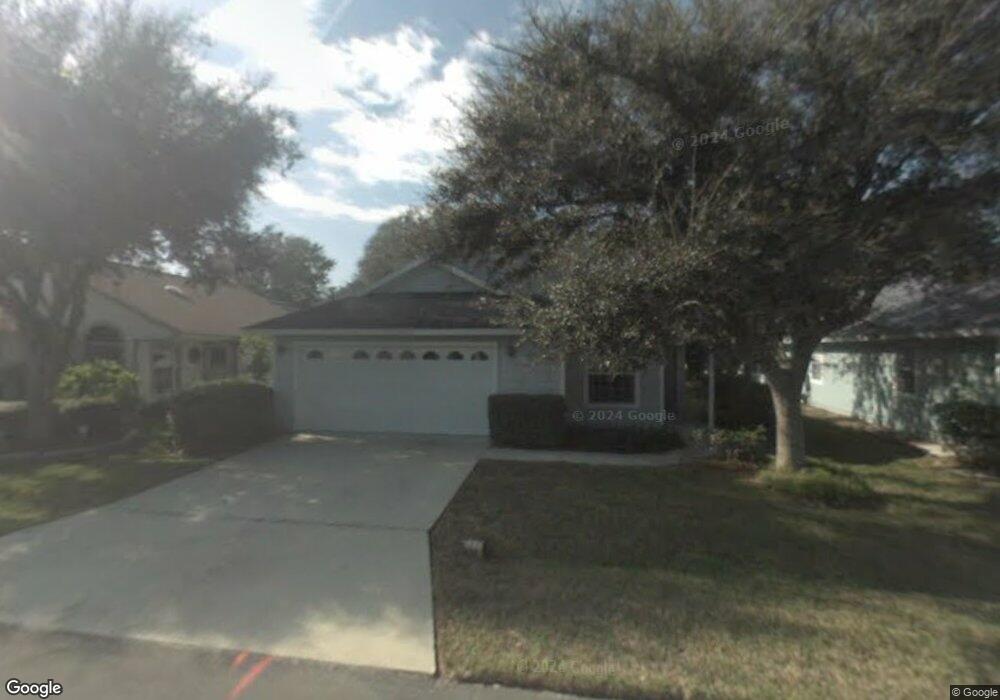
38 Andover Dr Palm Coast, FL 32137
Estimated Value: $350,447 - $427,000
2
Beds
2
Baths
1,284
Sq Ft
$297/Sq Ft
Est. Value
About This Home
This home is located at 38 Andover Dr, Palm Coast, FL 32137 and is currently estimated at $381,612, approximately $297 per square foot. 38 Andover Dr is a home located in Flagler County with nearby schools including Old Kings Elementary School, Indian Trails Middle School, and Matanzas High School.
Ownership History
Date
Name
Owned For
Owner Type
Purchase Details
Closed on
Jun 13, 2008
Sold by
Simmons Sr John M and Simmons Jr John M
Bought by
Simmons Sr John M and Simmons Cheryl M
Current Estimated Value
Home Financials for this Owner
Home Financials are based on the most recent Mortgage that was taken out on this home.
Original Mortgage
$200,000
Outstanding Balance
$127,813
Interest Rate
5.97%
Mortgage Type
New Conventional
Estimated Equity
$253,799
Purchase Details
Closed on
Mar 25, 2008
Sold by
Cunningham Maria J and Cunningham Richard
Bought by
Simmons Sr John M and Simmons Jr John M
Create a Home Valuation Report for This Property
The Home Valuation Report is an in-depth analysis detailing your home's value as well as a comparison with similar homes in the area
Home Values in the Area
Average Home Value in this Area
Purchase History
| Date | Buyer | Sale Price | Title Company |
|---|---|---|---|
| Simmons Sr John M | -- | Estate Title Llc | |
| Simmons Sr John M | $192,500 | Estate Title Llc |
Source: Public Records
Mortgage History
| Date | Status | Borrower | Loan Amount |
|---|---|---|---|
| Open | Simmons Sr John M | $200,000 |
Source: Public Records
Tax History Compared to Growth
Tax History
| Year | Tax Paid | Tax Assessment Tax Assessment Total Assessment is a certain percentage of the fair market value that is determined by local assessors to be the total taxable value of land and additions on the property. | Land | Improvement |
|---|---|---|---|---|
| 2024 | $4,342 | $296,375 | $101,000 | $195,375 |
| 2023 | $4,342 | $257,492 | $0 | $0 |
| 2022 | $3,844 | $259,099 | $101,000 | $158,099 |
| 2021 | $3,439 | $214,359 | $92,500 | $121,859 |
| 2020 | $3,212 | $197,737 | $90,000 | $107,737 |
| 2019 | $2,952 | $175,381 | $80,000 | $95,381 |
| 2018 | $2,943 | $170,643 | $76,000 | $94,643 |
| 2017 | $2,830 | $161,568 | $76,000 | $85,568 |
| 2016 | $2,716 | $152,737 | $0 | $0 |
| 2015 | $2,696 | $151,175 | $0 | $0 |
| 2014 | $2,498 | $137,432 | $0 | $0 |
Source: Public Records
Map
Nearby Homes