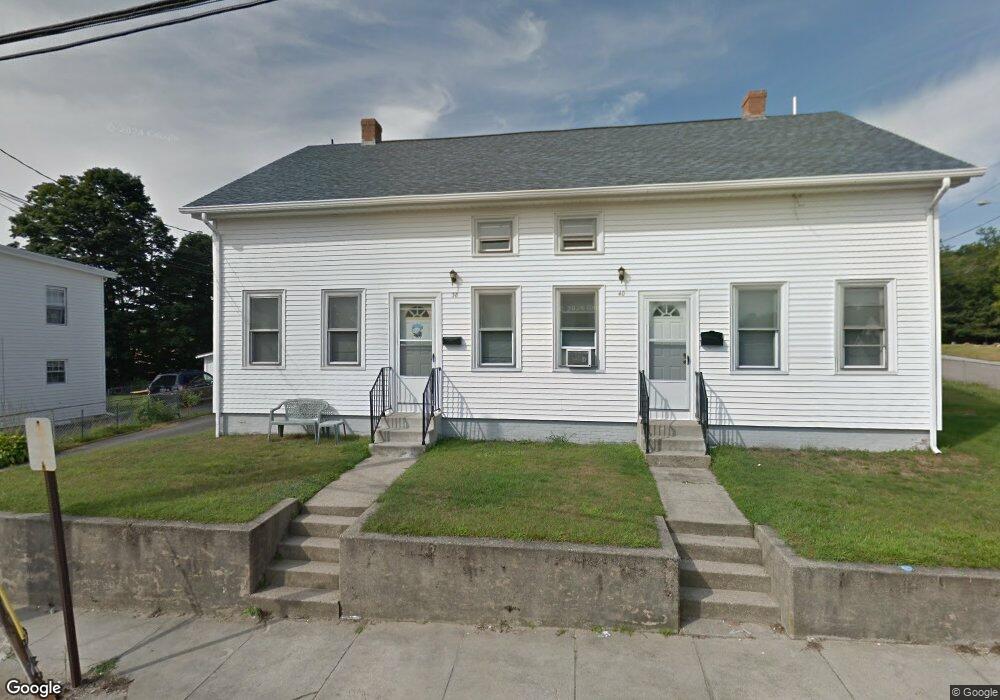
38 Anthony St Coventry, RI 02816
Estimated Value: $386,791 - $551,000
8
Beds
2
Baths
2,001
Sq Ft
$240/Sq Ft
Est. Value
About This Home
This home is located at 38 Anthony St, Coventry, RI 02816 and is currently estimated at $481,198, approximately $240 per square foot. 38 Anthony St is a home located in Kent County with nearby schools including Alan Shawn Feinstein Ms Of Cov, Coventry High School, and Father John V. Doyle School.
Ownership History
Date
Name
Owned For
Owner Type
Purchase Details
Closed on
Jan 16, 2026
Sold by
Kusiak Scott E and Kusiak Michele L
Bought by
Kusiak Tara
Current Estimated Value
Home Financials for this Owner
Home Financials are based on the most recent Mortgage that was taken out on this home.
Original Mortgage
$309,000
Outstanding Balance
$309,000
Interest Rate
6.19%
Mortgage Type
New Conventional
Estimated Equity
$172,198
Purchase Details
Closed on
Nov 26, 2025
Sold by
Sek Llc
Bought by
Kusiak Scott E and Kusiak Michele L
Home Financials for this Owner
Home Financials are based on the most recent Mortgage that was taken out on this home.
Original Mortgage
$309,000
Outstanding Balance
$309,000
Interest Rate
6.19%
Mortgage Type
New Conventional
Estimated Equity
$172,198
Purchase Details
Closed on
Apr 10, 2025
Sold by
Kusiak Scott E and Kusiak Michele L
Bought by
Sek Llc
Purchase Details
Closed on
Jan 30, 2009
Sold by
Betley Mary E Est and Kusiak
Bought by
Kusiak Scott E and Kusiak Michele L
Create a Home Valuation Report for This Property
The Home Valuation Report is an in-depth analysis detailing your home's value as well as a comparison with similar homes in the area
Purchase History
| Date | Buyer | Sale Price | Title Company |
|---|---|---|---|
| Kusiak Tara | $450,000 | -- | |
| Kusiak Scott E | -- | -- | |
| Sek Llc | -- | None Available | |
| Sek Llc | -- | None Available | |
| Kusiak Scott E | $108,000 | -- | |
| Kusiak Scott E | $108,000 | -- |
Source: Public Records
Mortgage History
| Date | Status | Borrower | Loan Amount |
|---|---|---|---|
| Open | Kusiak Tara | $309,000 | |
| Previous Owner | Kusiak Scott E | $88,000 |
Source: Public Records
Tax History
| Year | Tax Paid | Tax Assessment Tax Assessment Total Assessment is a certain percentage of the fair market value that is determined by local assessors to be the total taxable value of land and additions on the property. | Land | Improvement |
|---|---|---|---|---|
| 2025 | $4,212 | $261,800 | $76,500 | $185,300 |
| 2024 | $4,147 | $261,800 | $76,500 | $185,300 |
| 2023 | $4,013 | $261,800 | $76,500 | $185,300 |
| 2022 | $4,037 | $206,300 | $74,800 | $131,500 |
| 2021 | $4,002 | $206,300 | $74,800 | $131,500 |
| 2020 | $4,588 | $206,300 | $74,800 | $131,500 |
| 2019 | $3,454 | $155,300 | $57,000 | $98,300 |
| 2018 | $3,356 | $155,300 | $57,000 | $98,300 |
| 2017 | $3,258 | $155,300 | $57,000 | $98,300 |
| 2016 | $3,293 | $153,800 | $49,000 | $104,800 |
| 2015 | $3,204 | $153,800 | $49,000 | $104,800 |
| 2014 | $3,137 | $153,800 | $49,000 | $104,800 |
| 2013 | $3,320 | $177,900 | $57,600 | $120,300 |
Source: Public Records
Map
Nearby Homes
- 31 Anthony St Unit 33
- 32 Pilgrim Ave
- 27 Matteson St
- 123 Doolittle St
- 9 Regent St Unit 11
- 168 Knotty Oak Rd
- 0 Beaulieu Ave
- 175 Gervais St
- 87 Bates Ave
- 58 Read Ave
- 78 Gervais St
- 37 Phillip St
- 37 Holden St
- 91 Windsor Park Dr
- 33-35 Holden St
- 22 Wood St
- 33 Holden St Unit 35
- 2 Ritchotte Ct
- 11 Wood St
- 37 West St
Your Personal Tour Guide
Ask me questions while you tour the home.