Estimated Value: $721,000 - $808,000
4
Beds
3
Baths
2,905
Sq Ft
$261/Sq Ft
Est. Value
About This Home
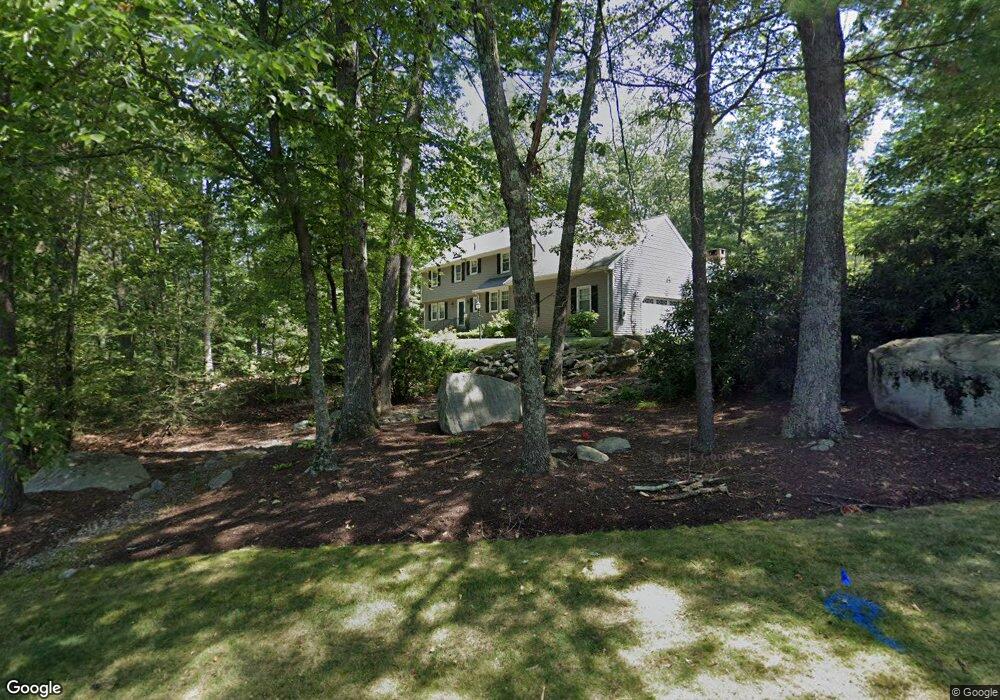
This home is located at 38 Anvil Dr, Avon, CT 06001 and is currently estimated at $758,495, approximately $261 per square foot. 38 Anvil Dr is a home located in Hartford County with nearby schools including Roaring Brook School, Thompson Brook School, and Avon Middle School.
Ownership History
Date
Name
Owned For
Owner Type
Purchase Details
Closed on
Jun 17, 2020
Sold by
Meholic Steven C
Bought by
Meholic Steven C and Meholic Susan C
Current Estimated Value
Purchase Details
Closed on
Oct 13, 2004
Sold by
Lichtmacher Pola
Bought by
Meholic Steven C
Home Financials for this Owner
Home Financials are based on the most recent Mortgage that was taken out on this home.
Original Mortgage
$330,000
Interest Rate
5.8%
Purchase Details
Closed on
Sep 16, 2003
Sold by
Hensler Brian D and Hensler Pamela N
Bought by
Lichtmacher Pola
Purchase Details
Closed on
Sep 1, 2000
Sold by
Duplessis Leon P and Duplessis Ann K
Bought by
Hensler Brian D and Hensler Pamela N
Purchase Details
Closed on
Jul 16, 1996
Sold by
Fay Thomas and Fay Paula
Bought by
Duplessis Leon and Duplessis Ann
Purchase Details
Closed on
Nov 16, 1987
Sold by
Clarke Thomas
Bought by
Fay Thomas
Create a Home Valuation Report for This Property
The Home Valuation Report is an in-depth analysis detailing your home's value as well as a comparison with similar homes in the area
Home Values in the Area
Average Home Value in this Area
Purchase History
| Date | Buyer | Sale Price | Title Company |
|---|---|---|---|
| Meholic Steven C | -- | None Available | |
| Meholic Steven C | -- | None Available | |
| Meholic Steven C | $455,000 | -- | |
| Meholic Steven C | $455,000 | -- | |
| Lichtmacher Pola | $405,000 | -- | |
| Lichtmacher Pola | $405,000 | -- | |
| Hensler Brian D | $355,000 | -- | |
| Hensler Brian D | $355,000 | -- | |
| Duplessis Leon | $288,500 | -- | |
| Duplessis Leon | $288,500 | -- | |
| Fay Thomas | $375,000 | -- |
Source: Public Records
Mortgage History
| Date | Status | Borrower | Loan Amount |
|---|---|---|---|
| Previous Owner | Fay Thomas | $330,000 |
Source: Public Records
Tax History
| Year | Tax Paid | Tax Assessment Tax Assessment Total Assessment is a certain percentage of the fair market value that is determined by local assessors to be the total taxable value of land and additions on the property. | Land | Improvement |
|---|---|---|---|---|
| 2025 | $11,880 | $386,350 | $115,610 | $270,740 |
| 2024 | $11,459 | $386,350 | $115,610 | $270,740 |
| 2023 | $10,561 | $298,430 | $94,610 | $203,820 |
| 2022 | $10,329 | $298,430 | $94,610 | $203,820 |
| 2021 | $10,209 | $298,430 | $94,610 | $203,820 |
| 2020 | $9,818 | $298,430 | $94,610 | $203,820 |
| 2019 | $9,818 | $298,430 | $94,610 | $203,820 |
| 2018 | $9,535 | $304,140 | $94,610 | $209,530 |
| 2017 | $9,304 | $304,140 | $94,610 | $209,530 |
| 2016 | $8,978 | $304,140 | $94,610 | $209,530 |
| 2015 | $8,759 | $304,140 | $94,610 | $209,530 |
| 2014 | $8,613 | $304,140 | $94,610 | $209,530 |
Source: Public Records
Map
Nearby Homes
- 39 High Ridge Hollow
- 373 Collinsville Rd
- 40 Homestead Ln
- 15 Greenwich Ln Unit 15
- 9 Putnam Ln
- 4 Strathmore Ln Unit 4
- 51 Westland Rd
- 28 Cottonwood Dr
- 25 Fenwick Dr
- 14 Walnut Ln
- 7 Maple Ln
- 7 Hadley Dr
- 7 Chestnut Dr
- 145 Hollister Dr
- 138 Northington Dr
- 8919 Taine Mountain Rd
- 2 Ventres Way
- 28 Sepous Rd
- 39 Heritage Dr Unit 39
- 29 Crocus Ln
Your Personal Tour Guide
Ask me questions while you tour the home.