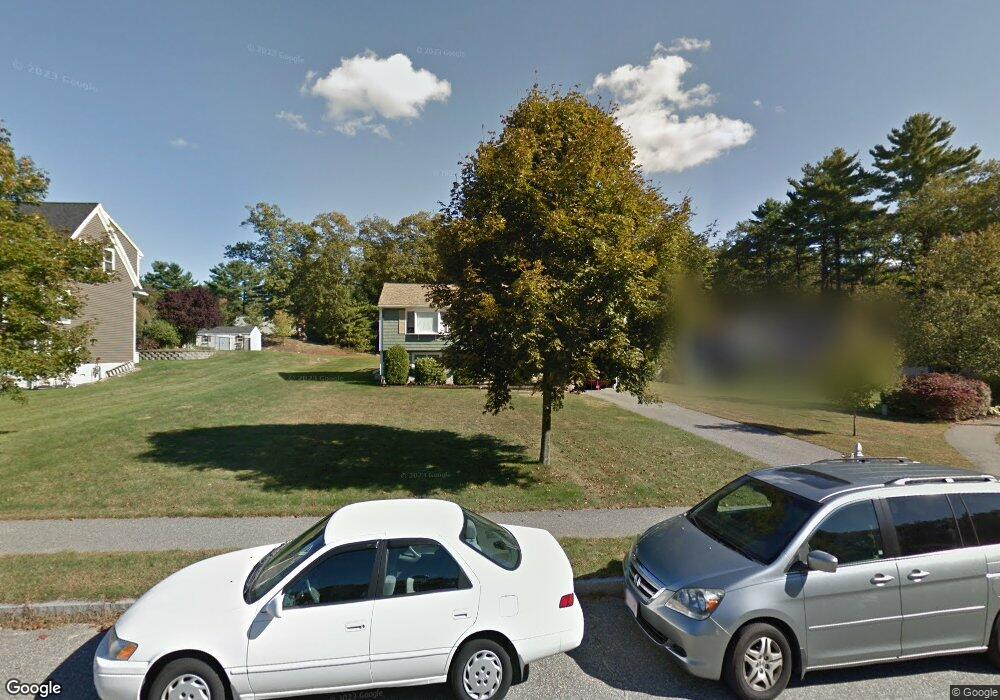
38 Apache Way Wilmington, MA 01887
Estimated Value: $631,000 - $1,000,000
3
Beds
2
Baths
1,288
Sq Ft
$615/Sq Ft
Est. Value
About This Home
This home is located at 38 Apache Way, Wilmington, MA 01887 and is currently estimated at $791,646, approximately $614 per square foot. 38 Apache Way is a home located in Middlesex County with nearby schools including Wilmington Middle School, Wilmington High School, and Abundant Life Christian School and Childcare.
Ownership History
Date
Name
Owned For
Owner Type
Purchase Details
Closed on
Feb 18, 1997
Sold by
Northeastern Dev Corp
Bought by
Corby Steven F
Current Estimated Value
Home Financials for this Owner
Home Financials are based on the most recent Mortgage that was taken out on this home.
Original Mortgage
$200,800
Outstanding Balance
$22,782
Interest Rate
7.6%
Mortgage Type
Purchase Money Mortgage
Estimated Equity
$768,864
Create a Home Valuation Report for This Property
The Home Valuation Report is an in-depth analysis detailing your home's value as well as a comparison with similar homes in the area
Purchase History
| Date | Buyer | Sale Price | Title Company |
|---|---|---|---|
| Corby Steven F | $232,465 | -- |
Source: Public Records
Mortgage History
| Date | Status | Borrower | Loan Amount |
|---|---|---|---|
| Open | Corby Steven F | $50,000 | |
| Open | Corby Steven F | $200,800 |
Source: Public Records
Tax History
| Year | Tax Paid | Tax Assessment Tax Assessment Total Assessment is a certain percentage of the fair market value that is determined by local assessors to be the total taxable value of land and additions on the property. | Land | Improvement |
|---|---|---|---|---|
| 2025 | $7,978 | $696,800 | $346,900 | $349,900 |
| 2024 | $7,910 | $692,000 | $346,900 | $345,100 |
| 2023 | $7,386 | $618,600 | $294,300 | $324,300 |
| 2022 | $7,026 | $539,200 | $245,200 | $294,000 |
| 2021 | $6,944 | $501,700 | $222,800 | $278,900 |
| 2020 | $7,366 | $542,400 | $222,800 | $319,600 |
| 2019 | $6,904 | $502,100 | $218,000 | $284,100 |
| 2018 | $6,483 | $449,900 | $207,600 | $242,300 |
| 2017 | $6,370 | $440,800 | $207,600 | $233,200 |
| 2016 | $6,109 | $417,600 | $197,800 | $219,800 |
| 2015 | $5,813 | $404,500 | $197,800 | $206,700 |
| 2014 | $5,467 | $383,900 | $188,400 | $195,500 |
Source: Public Records
Map
Nearby Homes
- 220 Burlington Ave
- 48 Brand Ave
- 6 Patricia Cir
- 224 Burlington Ave
- 255 Burlington Ave
- 3 Clark Terrace
- 56 Grove Ave
- 14 Manning St
- 46 Cottage St
- 11 Edgeworth St
- 6 Glade St
- 3 Memory Ln
- 35 Oak St
- 14 Sarah St
- 95 Bellflower Rd
- 25 Mill Rd
- 29 Beaverbrook Rd
- 7 Cross St Unit 303
- 7 Cross St Unit 205
- 7 Cross St Unit 306
Your Personal Tour Guide
Ask me questions while you tour the home.