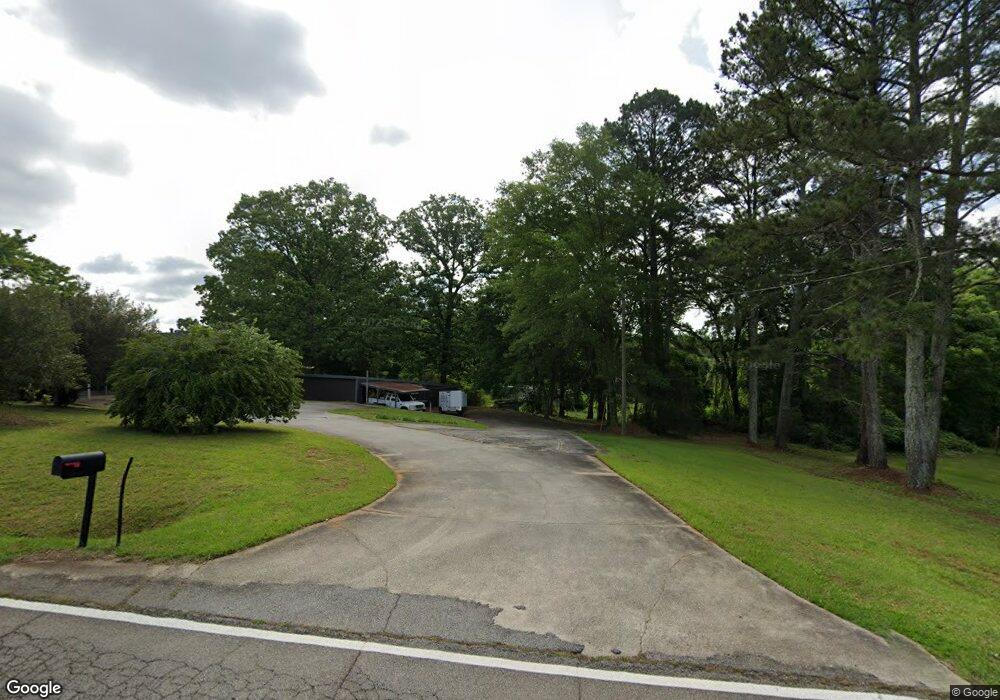
38 Bagwell Rd Carrollton, GA 30117
Estimated Value: $296,000 - $327,000
3
Beds
2
Baths
1,980
Sq Ft
$159/Sq Ft
Est. Value
About This Home
This home is located at 38 Bagwell Rd, Carrollton, GA 30117 and is currently estimated at $314,433, approximately $158 per square foot. 38 Bagwell Rd is a home located in Carroll County with nearby schools including Mt. Zion Elementary School, Mt. Zion Middle School, and Mt. Zion High School.
Ownership History
Date
Name
Owned For
Owner Type
Purchase Details
Closed on
Jul 24, 2025
Sold by
Ledbetter Taylor
Bought by
B2 Holdings Real Estate Llc
Current Estimated Value
Purchase Details
Closed on
Jul 18, 2025
Sold by
Denney Marvis Lee
Bought by
Ledbetter Taylor
Purchase Details
Closed on
Oct 7, 2019
Sold by
Denney Marvis Lee
Bought by
Ledbetter Taylor
Home Financials for this Owner
Home Financials are based on the most recent Mortgage that was taken out on this home.
Original Mortgage
$123,500
Interest Rate
3.4%
Mortgage Type
New Conventional
Purchase Details
Closed on
Feb 9, 2018
Sold by
M & P Denney Lllp
Bought by
Denney Marvis Lee
Purchase Details
Closed on
Sep 4, 2015
Sold by
Denney Marvis
Bought by
Denney Gregory Lee
Purchase Details
Closed on
Sep 27, 2012
Sold by
Denney Peggy
Bought by
M & P Denney Lllp
Purchase Details
Closed on
Feb 21, 1975
Bought by
Denny Peggy and Denny Marvis
Create a Home Valuation Report for This Property
The Home Valuation Report is an in-depth analysis detailing your home's value as well as a comparison with similar homes in the area
Home Values in the Area
Average Home Value in this Area
Purchase History
| Date | Buyer | Sale Price | Title Company |
|---|---|---|---|
| B2 Holdings Real Estate Llc | $325,000 | -- | |
| Ledbetter Taylor | -- | -- | |
| Ledbetter Taylor | $130,000 | -- | |
| Denney Marvis Lee | -- | -- | |
| Denney Gregory Lee | -- | -- | |
| Denney Marvis | -- | -- | |
| M & P Denney Lllp | -- | -- | |
| Denny Peggy | -- | -- |
Source: Public Records
Mortgage History
| Date | Status | Borrower | Loan Amount |
|---|---|---|---|
| Previous Owner | Ledbetter Taylor | $123,500 |
Source: Public Records
Tax History Compared to Growth
Tax History
| Year | Tax Paid | Tax Assessment Tax Assessment Total Assessment is a certain percentage of the fair market value that is determined by local assessors to be the total taxable value of land and additions on the property. | Land | Improvement |
|---|---|---|---|---|
| 2024 | $2,149 | $94,982 | $11,298 | $83,684 |
| 2023 | $2,149 | $85,493 | $9,038 | $76,455 |
| 2022 | $1,713 | $68,302 | $6,916 | $61,386 |
| 2021 | $1,502 | $58,587 | $5,533 | $53,054 |
| 2020 | $1,342 | $52,286 | $5,030 | $47,256 |
| 2019 | $1,247 | $48,196 | $5,030 | $43,166 |
| 2018 | $1,156 | $44,040 | $4,701 | $39,339 |
| 2017 | $1,160 | $44,040 | $4,701 | $39,339 |
| 2016 | $1,428 | $54,211 | $16,600 | $37,611 |
| 2015 | $2,715 | $97,091 | $16,600 | $80,491 |
| 2014 | $2,727 | $97,091 | $16,600 | $80,491 |
Source: Public Records
Map
Nearby Homes
- 50 Green Acres Dr
- 2464 N 27 Highway & Bagwell Rd
- 2990 N Highway 27
- 0 Hwy 27 N
- 77 Little River Rd
- 125 Springwood Dr
- 102 Buell Jones Rd
- 45 Buell Jones Rd
- 219 Candlewood Dr
- 00 Hog Liver Rd Unit 346
- 0 Hog Liver Rd Unit 148331
- 0 Hog Liver Rd Unit 10630257
- 0 Hog Liver Rd Unit 7671087
- 0 Hog Liver Rd Unit 10614601
- 0 Hog Liver Rd Unit 10630818
- 345 Henson Cir
- 0000 Hog Liver Rd
- 113 Richmond Dr
- 524 Old Bremen Rd
- 114 Kyle Way
- 2694 N Highway 27
- 2694 U S 27
- 00 Bagwell Rd
- 0 Bagwell Rd
- 0 Bagwell Rd Unit 20058968
- 0 Bagwell Rd Unit 7280674
- 0 Bagwell Rd Unit 7275710
- 60 Bagwell Rd
- 2724 U S 27
- 2717 N Highway 27
- 204 Bagwell Rd
- 90 Bagwell Rd
- 2734 N Highway 27
- 2726 N Highway 27
- 2768 Us Highway 27
- 2574 Us Highway 27
- 2574 N Highway 27
- 2790 N Highway 27
- 110 Bagwell Rd
- 2796 N Highway 27