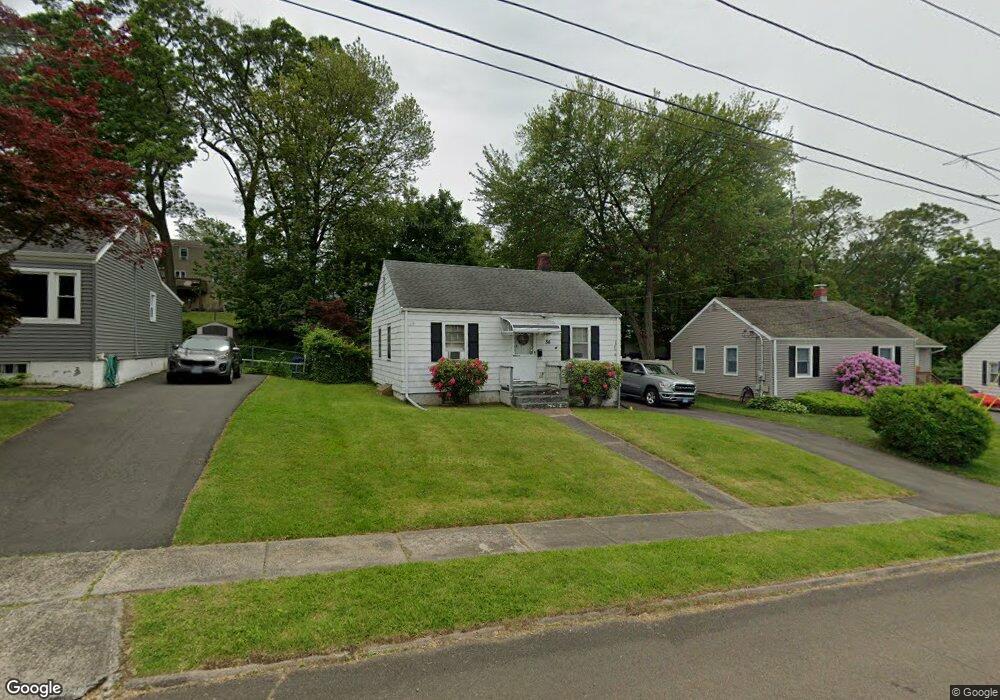
38 Barbara Ln West Haven, CT 06516
West Shore NeighborhoodEstimated Value: $280,224 - $298,000
2
Beds
1
Bath
672
Sq Ft
$428/Sq Ft
Est. Value
About This Home
This home is located at 38 Barbara Ln, West Haven, CT 06516 and is currently estimated at $287,306, approximately $427 per square foot. 38 Barbara Ln is a home located in New Haven County with nearby schools including Carrigan 5/6 Intermediate School, Harry M. Bailey Middle School, and West Haven High School.
Ownership History
Date
Name
Owned For
Owner Type
Purchase Details
Closed on
Jul 13, 2018
Sold by
Tressan L Quinn
Bought by
Johnson Nicholas S
Current Estimated Value
Home Financials for this Owner
Home Financials are based on the most recent Mortgage that was taken out on this home.
Original Mortgage
$158,650
Outstanding Balance
$137,585
Interest Rate
4.53%
Estimated Equity
$149,721
Create a Home Valuation Report for This Property
The Home Valuation Report is an in-depth analysis detailing your home's value as well as a comparison with similar homes in the area
Home Values in the Area
Average Home Value in this Area
Purchase History
| Date | Buyer | Sale Price | Title Company |
|---|---|---|---|
| Johnson Nicholas S | $167,000 | -- |
Source: Public Records
Mortgage History
| Date | Status | Borrower | Loan Amount |
|---|---|---|---|
| Open | Johnson Nicholas S | $158,650 | |
| Closed | Johnson Nicholas S | -- |
Source: Public Records
Tax History
| Year | Tax Paid | Tax Assessment Tax Assessment Total Assessment is a certain percentage of the fair market value that is determined by local assessors to be the total taxable value of land and additions on the property. | Land | Improvement |
|---|---|---|---|---|
| 2025 | $5,193 | $157,990 | $72,520 | $85,470 |
| 2024 | $4,477 | $95,550 | $50,260 | $45,290 |
| 2023 | $4,309 | $95,550 | $50,260 | $45,290 |
| 2022 | $4,232 | $95,550 | $50,260 | $45,290 |
| 2021 | $4,232 | $95,550 | $50,260 | $45,290 |
| 2020 | $4,236 | $87,150 | $45,990 | $41,160 |
| 2019 | $4,101 | $87,150 | $45,990 | $41,160 |
| 2018 | $4,043 | $87,150 | $45,990 | $41,160 |
| 2017 | $3,934 | $87,150 | $45,990 | $41,160 |
| 2016 | $3,890 | $87,150 | $45,990 | $41,160 |
| 2015 | $3,646 | $91,420 | $50,400 | $41,020 |
| 2014 | $3,646 | $91,420 | $50,400 | $41,020 |
Source: Public Records
Map
Nearby Homes
- 206 Highland Ave
- 74 Wilson Ave
- 99 Roosevelt Ave
- 86 Roosevelt Ave
- 22 Parker Ave
- 164 Arlington St
- 118 Arlington St
- 18 Albion Ave
- 45 Arlington St
- 40 Sorensen Rd
- 16 Sorensen Rd
- 920 Ocean Ave Unit E1
- 51 Woody Ln
- 292 Richmond Ave
- 330 Savin Ave Unit 76
- 330 Savin Ave Unit 32
- 70 Edward St
- 46 Central Ave
- 23 Warner Ave
- 24 Big Spruce Ln
Your Personal Tour Guide
Ask me questions while you tour the home.