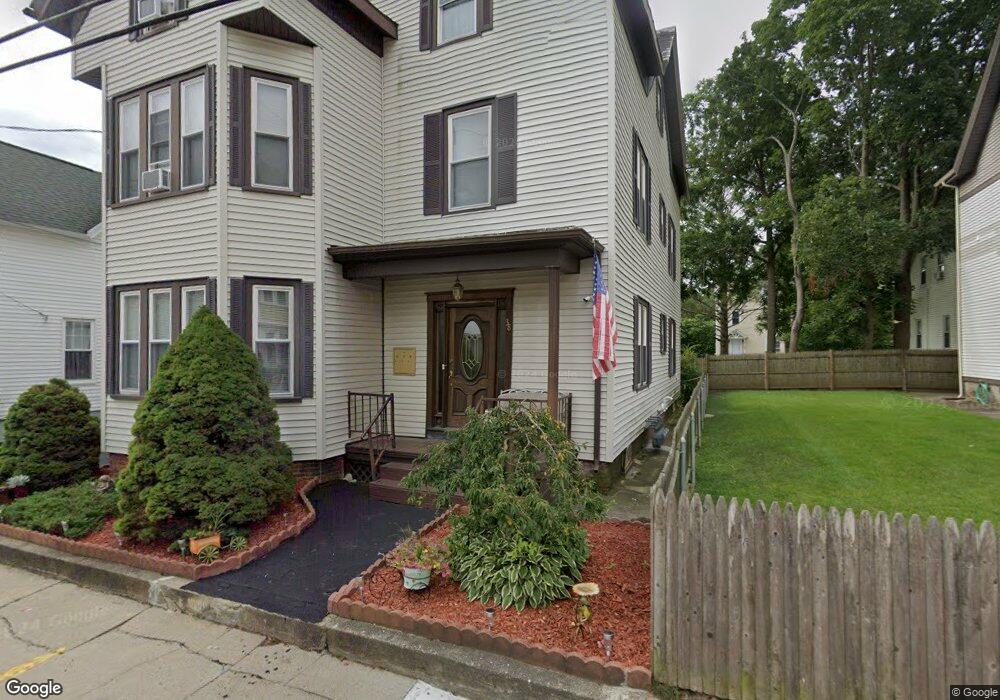
38 Barton St Woonsocket, RI 02895
North End NeighborhoodEstimated Value: $351,000 - $1,431,258
5
Beds
3
Baths
2,981
Sq Ft
$238/Sq Ft
Est. Value
About This Home
This home is located at 38 Barton St, Woonsocket, RI 02895 and is currently estimated at $709,315, approximately $237 per square foot. 38 Barton St is a home located in Providence County with nearby schools including Woonsocket High School, Rise Prep Mayoral Academy Middle School, and Rise Prep Mayoral Academy.
Ownership History
Date
Name
Owned For
Owner Type
Purchase Details
Closed on
Apr 22, 2022
Sold by
Corticelli Alan J and Corticelli Carol L
Bought by
Corticelli John J and Corticelli Michael A
Current Estimated Value
Purchase Details
Closed on
Sep 24, 1999
Sold by
Bloomberg Betty F
Bought by
Pearson Gregory J and Pearson Julie M
Home Financials for this Owner
Home Financials are based on the most recent Mortgage that was taken out on this home.
Original Mortgage
$342,227
Interest Rate
8.1%
Mortgage Type
Purchase Money Mortgage
Purchase Details
Closed on
Jan 1, 1987
Bought by
Corticelli Alan J and Corticelli Carol L
Create a Home Valuation Report for This Property
The Home Valuation Report is an in-depth analysis detailing your home's value as well as a comparison with similar homes in the area
Home Values in the Area
Average Home Value in this Area
Purchase History
| Date | Buyer | Sale Price | Title Company |
|---|---|---|---|
| Corticelli John J | -- | None Available | |
| Corticelli John J | -- | None Available | |
| Corticelli John J | -- | None Available | |
| Pearson Gregory J | $360,000 | -- | |
| Pearson Gregory J | $360,000 | -- | |
| Corticelli Alan J | -- | -- |
Source: Public Records
Mortgage History
| Date | Status | Borrower | Loan Amount |
|---|---|---|---|
| Previous Owner | Corticelli Alan J | $140,000 | |
| Previous Owner | Corticelli Alan J | $70,000 | |
| Previous Owner | Corticelli Alan J | $342,227 |
Source: Public Records
Tax History
| Year | Tax Paid | Tax Assessment Tax Assessment Total Assessment is a certain percentage of the fair market value that is determined by local assessors to be the total taxable value of land and additions on the property. | Land | Improvement |
|---|---|---|---|---|
| 2025 | $5,597 | $498,400 | $81,800 | $416,600 |
| 2024 | $4,973 | $342,000 | $83,300 | $258,700 |
| 2023 | $4,781 | $342,000 | $83,300 | $258,700 |
| 2022 | $4,781 | $342,000 | $83,300 | $258,700 |
| 2021 | $4,090 | $172,200 | $53,300 | $118,900 |
| 2020 | $4,133 | $172,200 | $53,300 | $118,900 |
| 2018 | $4,147 | $172,200 | $53,300 | $118,900 |
| 2017 | $4,479 | $148,800 | $37,200 | $111,600 |
| 2016 | $4,738 | $148,800 | $37,200 | $111,600 |
| 2015 | $5,578 | $152,500 | $37,200 | $115,300 |
| 2014 | $5,056 | $147,300 | $40,900 | $106,400 |
Source: Public Records
Map
Nearby Homes
- 481 N Main St
- 164 W School St
- 130 E School St
- 550 Winter St
- 187 Boyden St
- 571 Winter St
- 107 Blackstone St
- 154 156 Winter St
- 0 N Main St Unit 1401765
- 99 Cato St
- 115 Railroad St
- 256 Privilege St
- 60 Rathbun St
- 180 Allen St Unit 104
- 60 Fairlawn Ave
- 36 Fairmount St
- 0 Diamond Hill Rd Unit 1406968
- 35 Greene St
- 10 Huntington Ave
- 685 Social St Unit 308
Your Personal Tour Guide
Ask me questions while you tour the home.