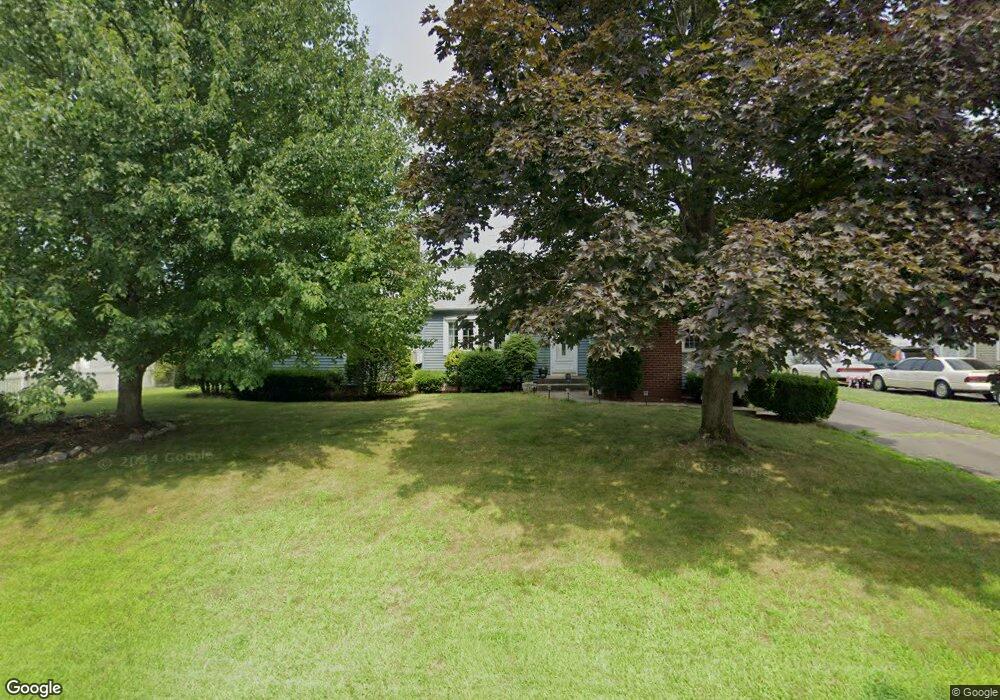
38 Basswood St Newington, CT 06111
Estimated Value: $387,000 - $447,000
2
Beds
2
Baths
1,967
Sq Ft
$207/Sq Ft
Est. Value
About This Home
This home is located at 38 Basswood St, Newington, CT 06111 and is currently estimated at $407,597, approximately $207 per square foot. 38 Basswood St is a home located in Hartford County with nearby schools including Ruth Chaffee School, John Wallace Middle School, and Newington High School.
Ownership History
Date
Name
Owned For
Owner Type
Purchase Details
Closed on
Apr 26, 2023
Sold by
Hodge Ronald M Est and Hodge
Bought by
Greca Robert
Current Estimated Value
Home Financials for this Owner
Home Financials are based on the most recent Mortgage that was taken out on this home.
Original Mortgage
$254,400
Outstanding Balance
$246,960
Interest Rate
6.32%
Mortgage Type
Stand Alone Refi Refinance Of Original Loan
Estimated Equity
$160,637
Purchase Details
Closed on
May 30, 2000
Sold by
Dehaas Michael and Dehaas Kristen A
Bought by
Hodge Ronald M and Hodge Jean H
Home Financials for this Owner
Home Financials are based on the most recent Mortgage that was taken out on this home.
Original Mortgage
$57,000
Interest Rate
8.1%
Mortgage Type
Purchase Money Mortgage
Purchase Details
Closed on
Feb 26, 1993
Sold by
Gioia Peter M and Gioia Rachel
Bought by
Dehaas Michael and Dehass Kristen A
Create a Home Valuation Report for This Property
The Home Valuation Report is an in-depth analysis detailing your home's value as well as a comparison with similar homes in the area
Home Values in the Area
Average Home Value in this Area
Purchase History
| Date | Buyer | Sale Price | Title Company |
|---|---|---|---|
| Greca Robert | $318,000 | None Available | |
| Greca Robert | $318,000 | None Available | |
| Hodge Ronald M | $175,000 | -- | |
| Dehaas Michael | $149,900 | -- | |
| Hodge Ronald M | $175,000 | -- | |
| Dehaas Michael | $149,900 | -- |
Source: Public Records
Mortgage History
| Date | Status | Borrower | Loan Amount |
|---|---|---|---|
| Open | Greca Robert | $254,400 | |
| Closed | Greca Robert | $254,400 | |
| Previous Owner | Dehaas Michael | $57,000 | |
| Previous Owner | Dehaas Michael | $13,500 |
Source: Public Records
Tax History Compared to Growth
Tax History
| Year | Tax Paid | Tax Assessment Tax Assessment Total Assessment is a certain percentage of the fair market value that is determined by local assessors to be the total taxable value of land and additions on the property. | Land | Improvement |
|---|---|---|---|---|
| 2025 | $7,563 | $189,170 | $53,550 | $135,620 |
| 2024 | $6,977 | $175,880 | $53,550 | $122,330 |
| 2023 | $6,747 | $175,880 | $53,550 | $122,330 |
| 2022 | $6,770 | $175,880 | $53,550 | $122,330 |
| 2021 | $6,826 | $175,880 | $53,550 | $122,330 |
| 2020 | $6,348 | $161,620 | $53,550 | $108,070 |
| 2019 | $6,376 | $161,620 | $53,550 | $108,070 |
| 2018 | $6,222 | $161,620 | $53,550 | $108,070 |
| 2017 | $5,914 | $161,620 | $53,550 | $108,070 |
| 2016 | $5,778 | $161,620 | $53,550 | $108,070 |
| 2014 | $5,508 | $158,400 | $53,470 | $104,930 |
Source: Public Records
Map
Nearby Homes
- 5 Copper Beech Ln
- 76 Clifford St
- 129 Glenview Dr
- 137 Superior Ave
- 193 Hillcrest Ave
- 263 Robbins Ave
- 111 Brockett St
- 91 Centerwood Rd
- 36 Sequin St
- 31 Fox Run Ct Unit 31
- 107 Fox Run Ct Unit 107
- 120 Fox Run Ct
- 36 Hartt Ln
- 98 Crown Ridge
- 760 Willard Ave
- 149 Foxboro Dr Unit 149
- 43 Steeplechase Dr Unit 43
- 274 Cedarwood Ln
- 35 Woodsedge Dr Unit 4C
- 31 Woodsedge Dr Unit 1C