Estimated Value: $338,000 - $390,596
4
Beds
3
Baths
2,772
Sq Ft
$131/Sq Ft
Est. Value
About This Home
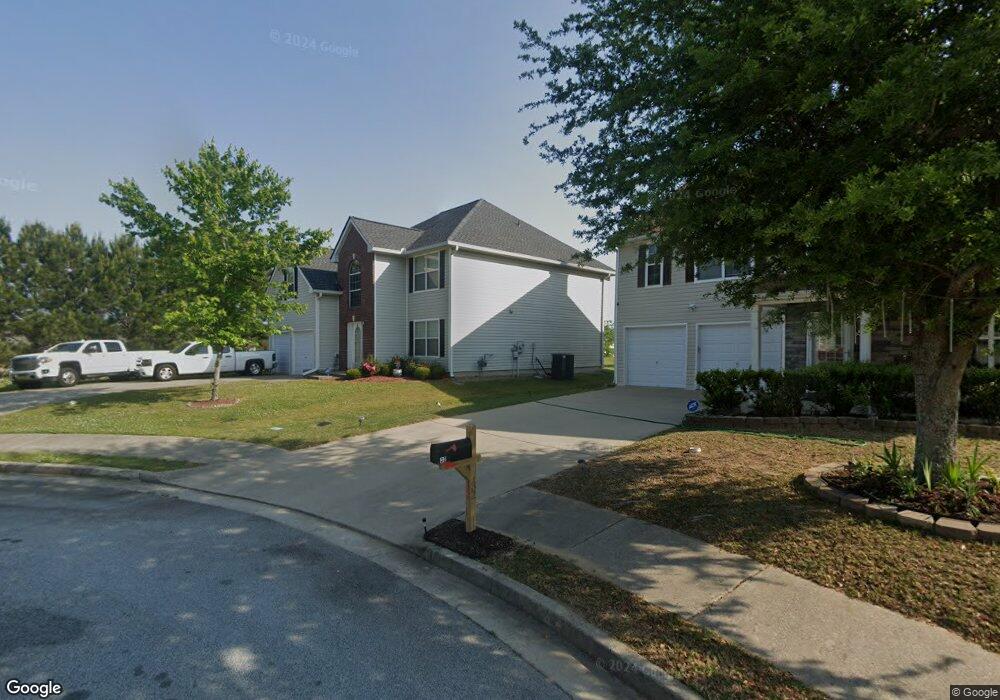
This home is located at 38 Bay Ct Unit 181, Hiram, GA 30141 and is currently estimated at $363,649, approximately $131 per square foot. 38 Bay Ct Unit 181 is a home located in Paulding County with nearby schools including Hiram Elementary School, P. B. Ritch Middle School, and Hiram High School.
Ownership History
Date
Name
Owned For
Owner Type
Purchase Details
Closed on
Aug 2, 2017
Sold by
Secretary Of Hud
Bought by
Mathis Ji D
Current Estimated Value
Home Financials for this Owner
Home Financials are based on the most recent Mortgage that was taken out on this home.
Original Mortgage
$171,041
Outstanding Balance
$144,425
Interest Rate
4.5%
Mortgage Type
FHA
Estimated Equity
$219,224
Purchase Details
Closed on
Jan 17, 2017
Sold by
Citimortgage Inc
Bought by
Sec Of Housing & Urban
Purchase Details
Closed on
Oct 4, 2016
Sold by
George B
Bought by
Citimortgage Inc
Purchase Details
Closed on
Jun 21, 2013
Sold by
White George Benjamin Jr Estate
Purchase Details
Closed on
Jul 21, 2005
Sold by
Legacy Communities Of Ballentine Po
Bought by
White George B
Home Financials for this Owner
Home Financials are based on the most recent Mortgage that was taken out on this home.
Original Mortgage
$175,493
Interest Rate
5.61%
Mortgage Type
VA
Create a Home Valuation Report for This Property
The Home Valuation Report is an in-depth analysis detailing your home's value as well as a comparison with similar homes in the area
Home Values in the Area
Average Home Value in this Area
Purchase History
| Date | Buyer | Sale Price | Title Company |
|---|---|---|---|
| Mathis Ji D | -- | -- | |
| Sec Of Housing & Urban | -- | -- | |
| Citimortgage Inc | $136,000 | -- | |
| -- | -- | -- | |
| White George B | $176,900 | -- |
Source: Public Records
Mortgage History
| Date | Status | Borrower | Loan Amount |
|---|---|---|---|
| Open | Mathis Ji D | $171,041 | |
| Previous Owner | White George B | $175,493 |
Source: Public Records
Tax History Compared to Growth
Tax History
| Year | Tax Paid | Tax Assessment Tax Assessment Total Assessment is a certain percentage of the fair market value that is determined by local assessors to be the total taxable value of land and additions on the property. | Land | Improvement |
|---|---|---|---|---|
| 2024 | $3,289 | $132,224 | $16,000 | $116,224 |
| 2023 | $3,478 | $133,404 | $16,000 | $117,404 |
| 2022 | $3,131 | $120,096 | $12,000 | $108,096 |
| 2021 | $2,566 | $88,292 | $8,000 | $80,292 |
| 2020 | $2,390 | $80,468 | $8,000 | $72,468 |
| 2019 | $2,330 | $77,324 | $8,000 | $69,324 |
| 2018 | $2,172 | $72,096 | $8,000 | $64,096 |
| 2017 | $1,662 | $65,104 | $8,000 | $57,104 |
| 2016 | $1,909 | $63,132 | $8,000 | $55,132 |
| 2015 | $1,814 | $58,944 | $8,000 | $50,944 |
| 2014 | $1,242 | $41,212 | $8,000 | $33,212 |
| 2013 | -- | $35,560 | $8,000 | $27,560 |
Source: Public Records
Map
Nearby Homes
- 98 Baywood Way
- 273 Baywood Crossing
- 143 Birch St
- 322 Lanier Ct
- 79 Kennedy Ct
- 2393 Bill Carruth Pkwy
- 149 Willow Bend Rd
- 133 Willow Bend Rd
- 149 Willow Bend Dr
- 133 Willow Bend Dr
- 14 Berkten Ct
- 194 Prospect Path
- 153 Oak St
- 585 Hiram Douglasville Hwy
- 7799 Nebo Rd
- 7606 Nebo Rd
- 491 Hiram Douglasville Hwy
- 209 Enterprise Path
- 304 Greystone Pkwy
- 261 Township Dr
- 38 Bay Ct
- 32 Bay Ct
- 443 Baywood Way
- 443 Baywood Way Unit 213
- 453 Baywood Way
- 36 Bluff Ct
- 433 Baywood Way
- 463 Baywood Way
- 14 Bay Ct
- 14 Bay Ct Unit 14
- 14 Bay Ct
- 425 Baywood Way
- 101 Baywood Way
- 473 Baywood Way
- 473 Baywood Way Unit 216
- 42 Bluff Ct
- 43 Bay Ct
- 107 Baywood Way
- W Baywood Way Unit 216
- W Baywood Way