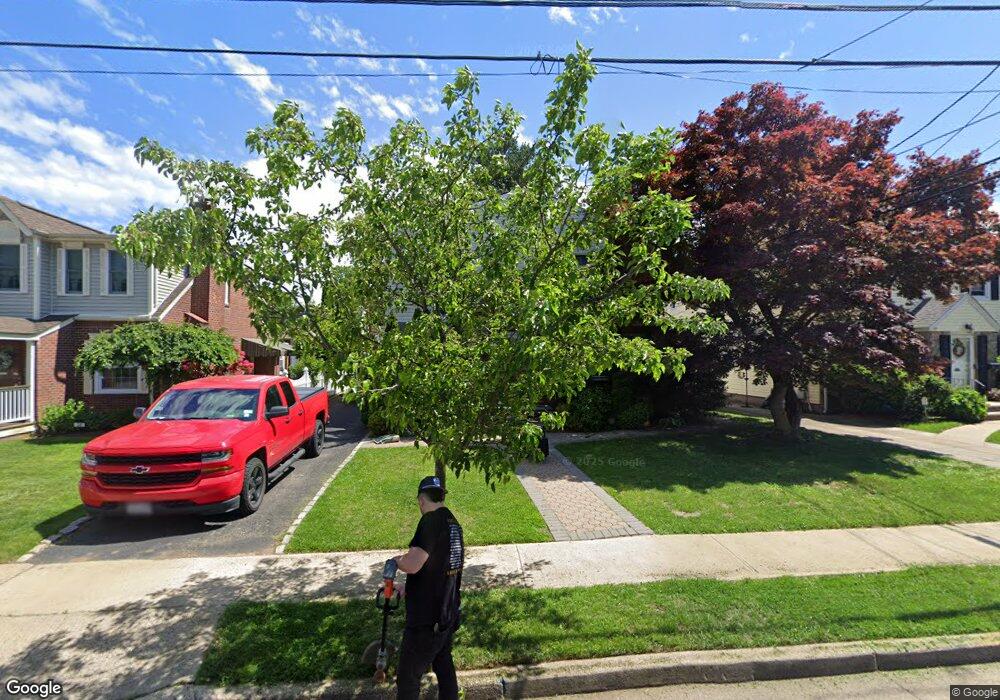
38 Beatrice Ct Hempstead, NY 11550
Estimated Value: $703,000 - $808,401
--
Bed
2
Baths
1,976
Sq Ft
$382/Sq Ft
Est. Value
About This Home
This home is located at 38 Beatrice Ct, Hempstead, NY 11550 and is currently estimated at $755,701, approximately $382 per square foot. 38 Beatrice Ct is a home located in Nassau County with nearby schools including The Academy Charter School, Crescent School, and St Joseph Elementary School.
Ownership History
Date
Name
Owned For
Owner Type
Purchase Details
Closed on
Jun 29, 2010
Sold by
Jackson Lyndon B
Bought by
Wanzer Merredith D
Current Estimated Value
Home Financials for this Owner
Home Financials are based on the most recent Mortgage that was taken out on this home.
Original Mortgage
$293,500
Outstanding Balance
$196,007
Interest Rate
4.82%
Mortgage Type
Purchase Money Mortgage
Estimated Equity
$559,694
Purchase Details
Closed on
Oct 22, 2009
Sold by
Wells Fargo Bank
Bought by
Jackson Lyndon B
Purchase Details
Closed on
Aug 12, 2003
Sold by
Lloyd Sandra
Bought by
Mestheneas Petros
Purchase Details
Closed on
Oct 27, 1999
Sold by
Mccarthy Mary Anne
Bought by
Lloyd Sandra
Home Financials for this Owner
Home Financials are based on the most recent Mortgage that was taken out on this home.
Original Mortgage
$218,500
Interest Rate
7.76%
Mortgage Type
Purchase Money Mortgage
Create a Home Valuation Report for This Property
The Home Valuation Report is an in-depth analysis detailing your home's value as well as a comparison with similar homes in the area
Home Values in the Area
Average Home Value in this Area
Purchase History
| Date | Buyer | Sale Price | Title Company |
|---|---|---|---|
| Wanzer Merredith D | $373,500 | -- | |
| Jackson Lyndon B | $250,000 | -- | |
| Mestheneas Petros | $375,000 | -- | |
| Lloyd Sandra | $230,000 | -- |
Source: Public Records
Mortgage History
| Date | Status | Borrower | Loan Amount |
|---|---|---|---|
| Open | Wanzer Merredith D | $293,500 | |
| Previous Owner | Lloyd Sandra | $218,500 |
Source: Public Records
Tax History Compared to Growth
Tax History
| Year | Tax Paid | Tax Assessment Tax Assessment Total Assessment is a certain percentage of the fair market value that is determined by local assessors to be the total taxable value of land and additions on the property. | Land | Improvement |
|---|---|---|---|---|
| 2025 | $11,886 | $513 | $144 | $369 |
| 2024 | $1,261 | $513 | $144 | $369 |
| 2023 | $10,478 | $542 | $152 | $390 |
| 2022 | $10,478 | $513 | $144 | $369 |
| 2021 | $12,538 | $525 | $141 | $384 |
| 2020 | $8,378 | $523 | $502 | $21 |
| 2019 | $7,320 | $560 | $504 | $56 |
| 2018 | $7,577 | $598 | $0 | $0 |
| 2017 | $6,851 | $635 | $508 | $127 |
| 2016 | $7,962 | $673 | $485 | $188 |
| 2015 | $1,189 | $710 | $490 | $220 |
| 2014 | $1,189 | $710 | $490 | $220 |
| 2013 | $1,158 | $747 | $515 | $232 |
Source: Public Records
Map
Nearby Homes
- 39 Hilbert St
- 47 Stratford Rd
- 35 Mulford Place
- 144 Hilton Ave
- 22 Mulford Place Unit 2D
- 22 Mulford Place Unit 6C
- 30 Cathedral Ave Unit 4A
- 82 Hilton Ave
- 200 Hilton Ave Unit 55
- 20 Wendell St Unit A16
- 20 Wendell St Unit E2
- 20 Wendell St Unit 39C
- 44 Saint Pauls Rd S
- 50 Mayfair Ave
- 170 Ivy St
- 252 Lexington Ave
- 60 Long Dr
- 253 William St
- 67 3rd St
- 144 N Franklin St