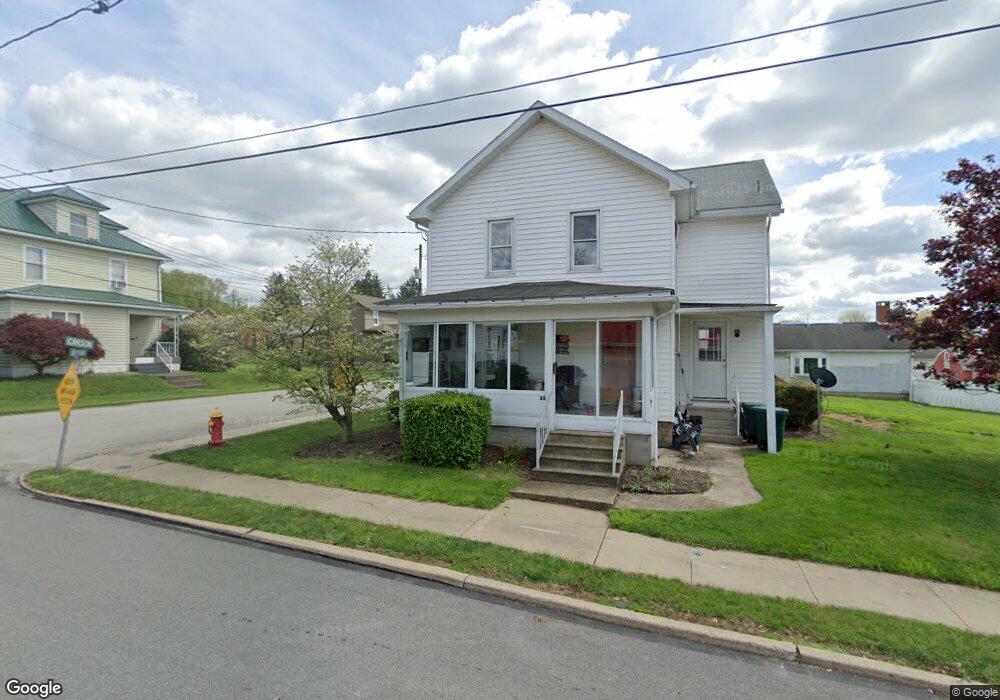
38 Bryan St Homer City, PA 15748
Estimated Value: $125,000 - $148,000
4
Beds
1
Bath
2,200
Sq Ft
$62/Sq Ft
Est. Value
About This Home
This home is located at 38 Bryan St, Homer City, PA 15748 and is currently estimated at $136,825, approximately $62 per square foot. 38 Bryan St is a home located in Indiana County with nearby schools including Homer-Center Elementary School and Homer-Center Junior/Senior High School.
Ownership History
Date
Name
Owned For
Owner Type
Purchase Details
Closed on
Sep 17, 2012
Sold by
Esachina Paul Edward and Maghrak Mary C
Bought by
Coleman Nathan R and Compton Coleman Angela L
Current Estimated Value
Home Financials for this Owner
Home Financials are based on the most recent Mortgage that was taken out on this home.
Original Mortgage
$44,000
Outstanding Balance
$2,037
Interest Rate
3.59%
Mortgage Type
New Conventional
Estimated Equity
$134,788
Create a Home Valuation Report for This Property
The Home Valuation Report is an in-depth analysis detailing your home's value as well as a comparison with similar homes in the area
Home Values in the Area
Average Home Value in this Area
Purchase History
| Date | Buyer | Sale Price | Title Company |
|---|---|---|---|
| Coleman Nathan R | $55,000 | None Available |
Source: Public Records
Mortgage History
| Date | Status | Borrower | Loan Amount |
|---|---|---|---|
| Open | Coleman Nathan R | $44,000 |
Source: Public Records
Tax History Compared to Growth
Tax History
| Year | Tax Paid | Tax Assessment Tax Assessment Total Assessment is a certain percentage of the fair market value that is determined by local assessors to be the total taxable value of land and additions on the property. | Land | Improvement |
|---|---|---|---|---|
| 2025 | $2,714 | $96,500 | $18,200 | $78,300 |
| 2024 | $2,676 | $96,500 | $18,200 | $78,300 |
| 2023 | $2,534 | $96,500 | $18,200 | $78,300 |
| 2022 | $2,421 | $96,500 | $18,200 | $78,300 |
| 2021 | $2,303 | $91,800 | $18,200 | $73,600 |
| 2020 | $2,261 | $91,800 | $18,200 | $73,600 |
| 2018 | $2,248 | $91,800 | $18,200 | $73,600 |
| 2017 | $2,259 | $91,800 | $18,200 | $73,600 |
| 2016 | -- | $91,800 | $18,200 | $73,600 |
| 2015 | -- | $11,810 | $1,120 | $10,690 |
| 2014 | -- | $11,810 | $1,120 | $10,690 |
Source: Public Records
Map
Nearby Homes