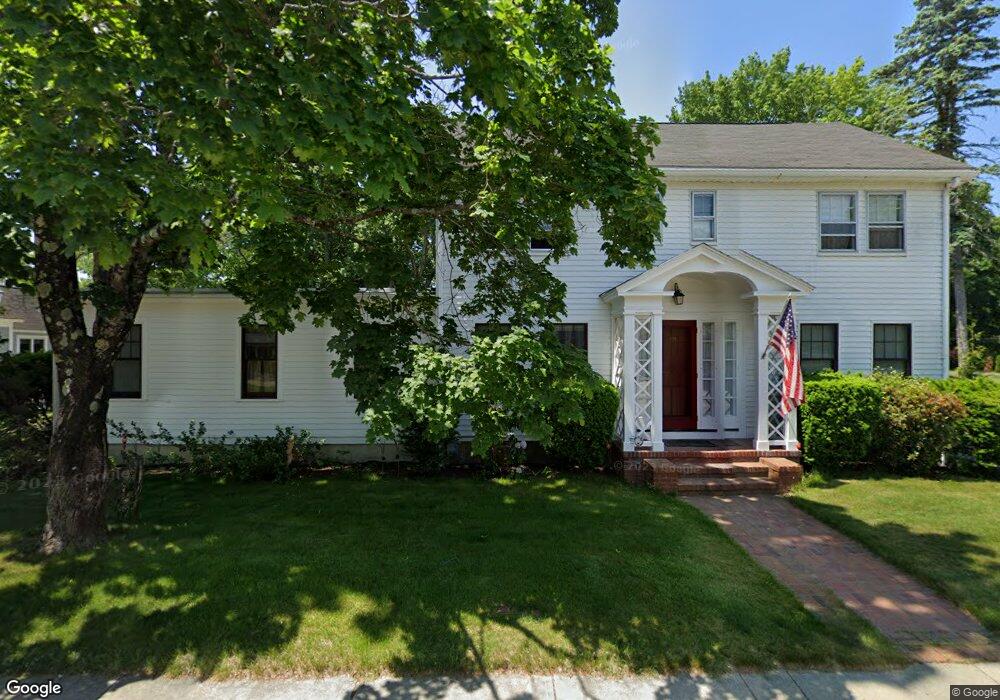
38 Capron St Uxbridge, MA 01569
Estimated Value: $622,030 - $685,000
4
Beds
3
Baths
2,584
Sq Ft
$252/Sq Ft
Est. Value
About This Home
This home is located at 38 Capron St, Uxbridge, MA 01569 and is currently estimated at $650,508, approximately $251 per square foot. 38 Capron St is a home located in Worcester County with nearby schools including Uxbridge High School, Our Lady of the Valley Regional School, and Whitinsville Christian School.
Ownership History
Date
Name
Owned For
Owner Type
Purchase Details
Closed on
Nov 15, 2023
Sold by
Hopper Dennis M and Hopper Isabel K
Bought by
D M & Isabel K Hopper Lt and Hopper
Current Estimated Value
Purchase Details
Closed on
May 20, 1999
Sold by
Welby Kathryn L
Bought by
Hopper C Michael C and Hopper Isabel R
Create a Home Valuation Report for This Property
The Home Valuation Report is an in-depth analysis detailing your home's value as well as a comparison with similar homes in the area
Home Values in the Area
Average Home Value in this Area
Purchase History
| Date | Buyer | Sale Price | Title Company |
|---|---|---|---|
| D M & Isabel K Hopper Lt | -- | None Available | |
| Hopper C Michael C | $20,000 | -- |
Source: Public Records
Mortgage History
| Date | Status | Borrower | Loan Amount |
|---|---|---|---|
| Previous Owner | Hopper C Michael C | $92,000 | |
| Previous Owner | Hopper C Michael C | $65,000 | |
| Previous Owner | Hopper C Michael C | $43,000 |
Source: Public Records
Tax History
| Year | Tax Paid | Tax Assessment Tax Assessment Total Assessment is a certain percentage of the fair market value that is determined by local assessors to be the total taxable value of land and additions on the property. | Land | Improvement |
|---|---|---|---|---|
| 2025 | $66 | $501,700 | $153,200 | $348,500 |
| 2024 | $6,105 | $472,500 | $145,400 | $327,100 |
| 2023 | $6,019 | $431,500 | $125,700 | $305,800 |
| 2022 | $5,688 | $375,200 | $110,000 | $265,200 |
| 2021 | $5,936 | $375,200 | $110,000 | $265,200 |
| 2020 | $6,140 | $366,800 | $111,600 | $255,200 |
| 2019 | $6,366 | $366,900 | $122,700 | $244,200 |
| 2018 | $6,200 | $361,100 | $122,700 | $238,400 |
| 2017 | $6,828 | $402,600 | $116,600 | $286,000 |
| 2016 | $6,002 | $341,600 | $85,600 | $256,000 |
| 2015 | $5,864 | $337,000 | $85,600 | $251,400 |
Source: Public Records
Map
Nearby Homes
- 24 Olde Canal Way Unit 24
- 56 S Main St
- 16 Farnum St
- 223 Mendon St
- 5 Peter St Unit D
- 79 High St
- 44 Pouts Ln
- 35 Pouts Ln
- 76 Pouts Ln
- 86 Hunter Rd
- 26 Rivulet St
- 3 Strathmore Shire Unit A
- 218 E Hartford Ave Unit 218
- 12 Hartford Ave E
- 71 Rivulet St Unit B
- 138 Elm St
- 197 Crownshield Ave Unit 16B
- 197 Crownshield Ave Unit 16A
- 197 Crownshield Ave Unit 16C
- 61 Spring Hill Dr Unit 61
Your Personal Tour Guide
Ask me questions while you tour the home.