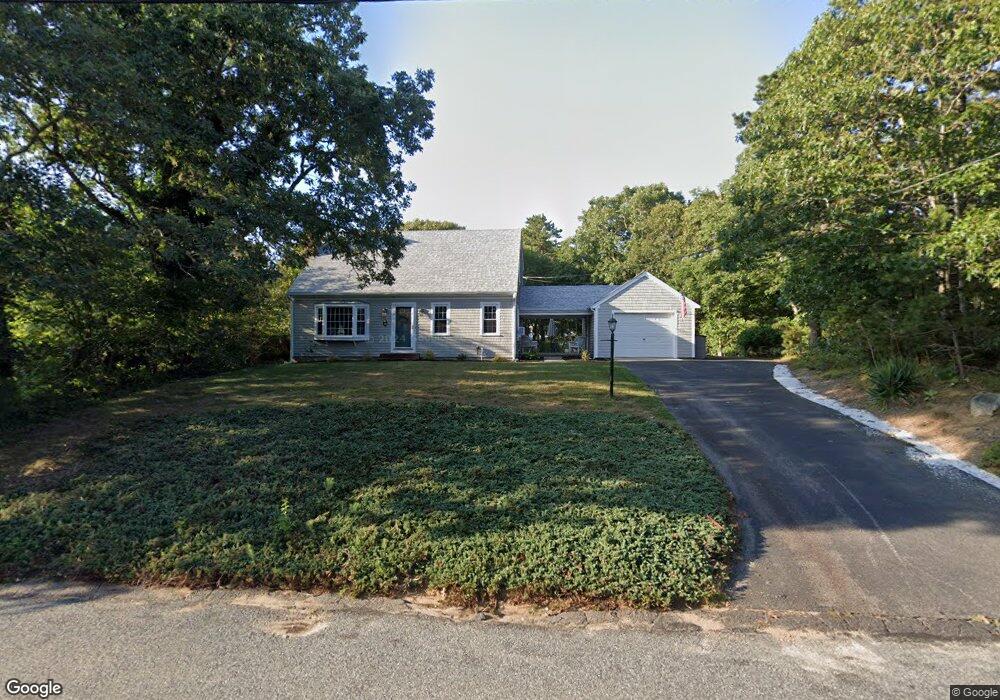
38 Charles Rd Harwich, MA 02645
East Harwich NeighborhoodEstimated Value: $624,000 - $762,000
4
Beds
2
Baths
2,201
Sq Ft
$326/Sq Ft
Est. Value
About This Home
This home is located at 38 Charles Rd, Harwich, MA 02645 and is currently estimated at $718,114, approximately $326 per square foot. 38 Charles Rd is a home located in Barnstable County with nearby schools including Harwich Elementary School, Chatham Elementary School, and Monomoy Regional Middle School.
Ownership History
Date
Name
Owned For
Owner Type
Purchase Details
Closed on
Nov 19, 2020
Sold by
Eileen T Grasso T
Bought by
Grasso Michael and Grasso Kara
Current Estimated Value
Home Financials for this Owner
Home Financials are based on the most recent Mortgage that was taken out on this home.
Original Mortgage
$250,000
Outstanding Balance
$222,464
Interest Rate
2.8%
Mortgage Type
New Conventional
Estimated Equity
$495,650
Purchase Details
Closed on
Jun 28, 2006
Sold by
Grasso Eileen T and Grasso Richard A
Bought by
Eileen T Grasso T and Grasso Eileen T
Purchase Details
Closed on
May 1, 1998
Sold by
Grosso Louis J and Grosso Mary M
Bought by
Grasso Richard A and Grasso Eileen T
Create a Home Valuation Report for This Property
The Home Valuation Report is an in-depth analysis detailing your home's value as well as a comparison with similar homes in the area
Home Values in the Area
Average Home Value in this Area
Purchase History
| Date | Buyer | Sale Price | Title Company |
|---|---|---|---|
| Grasso Michael | $375,000 | None Available | |
| Eileen T Grasso T | -- | -- | |
| Grasso Richard A | $148,950 | -- |
Source: Public Records
Mortgage History
| Date | Status | Borrower | Loan Amount |
|---|---|---|---|
| Open | Grasso Michael | $250,000 |
Source: Public Records
Tax History
| Year | Tax Paid | Tax Assessment Tax Assessment Total Assessment is a certain percentage of the fair market value that is determined by local assessors to be the total taxable value of land and additions on the property. | Land | Improvement |
|---|---|---|---|---|
| 2025 | $3,735 | $632,000 | $236,500 | $395,500 |
| 2024 | $3,450 | $572,200 | $194,100 | $378,100 |
| 2023 | $3,303 | $497,400 | $176,400 | $321,000 |
| 2022 | $3,250 | $400,700 | $153,400 | $247,300 |
| 2021 | $3,136 | $364,700 | $139,500 | $225,200 |
| 2020 | $3,126 | $358,100 | $136,600 | $221,500 |
| 2019 | $2,995 | $345,400 | $131,200 | $214,200 |
| 2018 | $2,920 | $322,100 | $119,300 | $202,800 |
| 2017 | $2,764 | $308,100 | $108,700 | $199,400 |
| 2016 | $2,696 | $297,200 | $108,700 | $188,500 |
| 2015 | $2,599 | $289,700 | $106,600 | $183,100 |
| 2014 | $2,650 | $302,200 | $103,400 | $198,800 |
Source: Public Records
Map
Nearby Homes
Your Personal Tour Guide
Ask me questions while you tour the home.