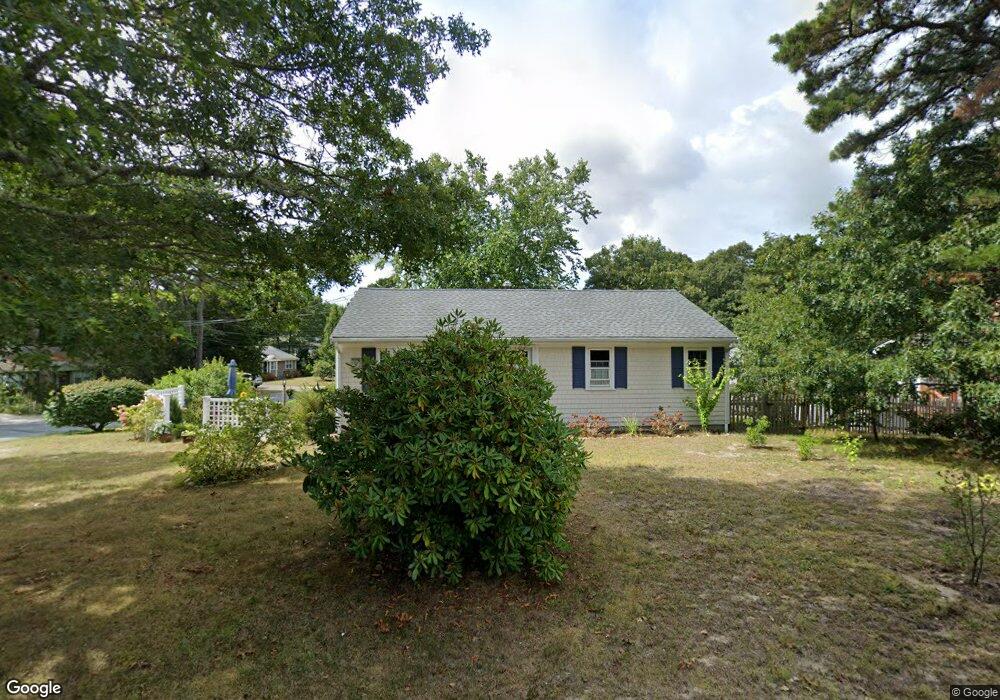
38 Charles St South Dennis, MA 02660
South Dennis NeighborhoodEstimated Value: $515,690 - $615,000
2
Beds
2
Baths
864
Sq Ft
$648/Sq Ft
Est. Value
About This Home
This home is located at 38 Charles St, South Dennis, MA 02660 and is currently estimated at $560,173, approximately $648 per square foot. 38 Charles St is a home located in Barnstable County with nearby schools including Dennis-Yarmouth Regional High School and St. Pius X. School.
Ownership History
Date
Name
Owned For
Owner Type
Purchase Details
Closed on
May 31, 1988
Sold by
Kane William P
Bought by
Emmett Nancy B
Current Estimated Value
Home Financials for this Owner
Home Financials are based on the most recent Mortgage that was taken out on this home.
Original Mortgage
$95,000
Interest Rate
10.18%
Mortgage Type
Purchase Money Mortgage
Create a Home Valuation Report for This Property
The Home Valuation Report is an in-depth analysis detailing your home's value as well as a comparison with similar homes in the area
Home Values in the Area
Average Home Value in this Area
Purchase History
| Date | Buyer | Sale Price | Title Company |
|---|---|---|---|
| Emmett Nancy B | $115,000 | -- |
Source: Public Records
Mortgage History
| Date | Status | Borrower | Loan Amount |
|---|---|---|---|
| Open | Emmett Nancy B | $140,000 | |
| Closed | Emmett Nancy B | $95,000 |
Source: Public Records
Tax History Compared to Growth
Tax History
| Year | Tax Paid | Tax Assessment Tax Assessment Total Assessment is a certain percentage of the fair market value that is determined by local assessors to be the total taxable value of land and additions on the property. | Land | Improvement |
|---|---|---|---|---|
| 2025 | $1,914 | $442,000 | $132,200 | $309,800 |
| 2024 | $1,831 | $417,100 | $127,200 | $289,900 |
| 2023 | $1,771 | $379,200 | $115,600 | $263,600 |
| 2022 | $1,739 | $310,600 | $115,700 | $194,900 |
| 2021 | $1,646 | $273,000 | $113,400 | $159,600 |
| 2020 | $1,575 | $258,200 | $113,400 | $144,800 |
| 2019 | $1,549 | $251,000 | $122,300 | $128,700 |
| 2018 | $1,404 | $221,500 | $105,900 | $115,600 |
| 2017 | $1,338 | $217,600 | $105,900 | $111,700 |
| 2016 | $1,237 | $189,500 | $111,200 | $78,300 |
| 2015 | $1,213 | $189,500 | $111,200 | $78,300 |
| 2014 | $1,169 | $184,100 | $95,300 | $88,800 |
Source: Public Records
Map
Nearby Homes
- 17 Margate Ln
- 11 Uncle Stanleys Way
- 153 Bayridge Dr
- 15 Captain Jud Rd
- 4 Ebb Rd
- 10 Joanne Dr
- 17 Fairmount Rd
- 17 Fairmount Rd
- 25 Skerry Rd
- 7 Vinland Dr
- 1 Norseman Dr
- 118 Driftwood Ln
- 129 Driftwood Ln
- 13 Covey Dr
- 62 Old Fish House Rd
- 6 Hawthorn St
- 111 Merchant Ave
- 32 Captain Walsh Dr
- 4 Old Colony Way
- 6 Nimble Hill Dr