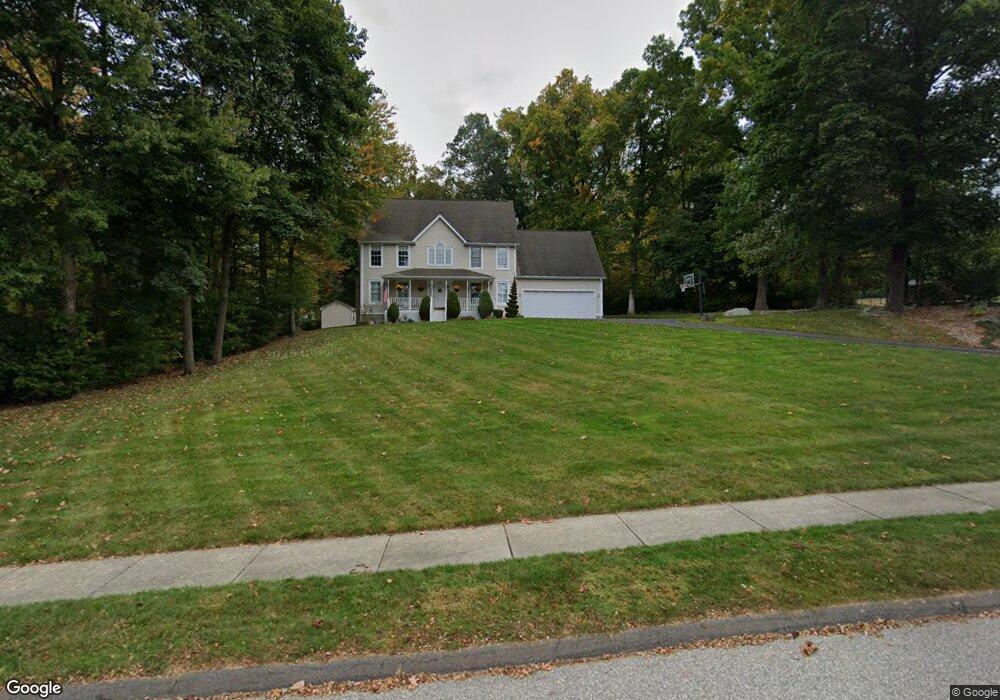
38 Chatham Fields Rd East Hampton, CT 06424
Estimated Value: $528,000 - $623,000
4
Beds
3
Baths
3,264
Sq Ft
$177/Sq Ft
Est. Value
About This Home
This home is located at 38 Chatham Fields Rd, East Hampton, CT 06424 and is currently estimated at $577,994, approximately $177 per square foot. 38 Chatham Fields Rd is a home located in Middlesex County with nearby schools including Memorial School, Center Elementary School, and East Hampton Middle School.
Ownership History
Date
Name
Owned For
Owner Type
Purchase Details
Closed on
Dec 14, 2020
Sold by
Penn Steven D
Bought by
Penn Pamela J
Current Estimated Value
Purchase Details
Closed on
Jul 6, 1999
Sold by
Edgerton Est Llc
Bought by
Penn Steven D and Penn Pamela J
Create a Home Valuation Report for This Property
The Home Valuation Report is an in-depth analysis detailing your home's value as well as a comparison with similar homes in the area
Home Values in the Area
Average Home Value in this Area
Purchase History
| Date | Buyer | Sale Price | Title Company |
|---|---|---|---|
| Penn Pamela J | -- | None Available | |
| Penn Pamela J | -- | None Available | |
| Penn Steven D | $62,000 | -- | |
| Penn Steven D | $62,000 | -- |
Source: Public Records
Mortgage History
| Date | Status | Borrower | Loan Amount |
|---|---|---|---|
| Previous Owner | Penn Steven D | $85,000 | |
| Previous Owner | Penn Steven D | $268,000 |
Source: Public Records
Tax History Compared to Growth
Tax History
| Year | Tax Paid | Tax Assessment Tax Assessment Total Assessment is a certain percentage of the fair market value that is determined by local assessors to be the total taxable value of land and additions on the property. | Land | Improvement |
|---|---|---|---|---|
| 2025 | $10,713 | $269,780 | $62,070 | $207,710 |
| 2024 | $10,262 | $269,780 | $62,070 | $207,710 |
| 2023 | $9,728 | $269,780 | $62,070 | $207,710 |
| 2022 | $9,351 | $269,780 | $62,070 | $207,710 |
| 2021 | $9,316 | $269,780 | $62,070 | $207,710 |
| 2020 | $10,091 | $304,510 | $62,070 | $242,440 |
| 2019 | $10,147 | $306,200 | $62,070 | $244,130 |
| 2018 | $9,590 | $306,200 | $62,070 | $244,130 |
| 2017 | $9,590 | $306,200 | $62,070 | $244,130 |
| 2016 | $9,015 | $306,200 | $62,070 | $244,130 |
| 2015 | $8,807 | $317,040 | $75,810 | $241,230 |
| 2014 | $7,663 | $317,040 | $75,810 | $241,230 |
Source: Public Records
Map
Nearby Homes
- 29 Watrous St
- 4 Watrous St
- 1 Watrous St
- 152 Main St
- 17 Bevin Blvd
- Homesite 10 Quinns Way
- 14 Main St
- 22 Lakeview St
- 68 Colchester Ave
- 62 Barton Hill Rd
- 81 Middletown Ave
- 1 Quinns Way
- 402 Lake Vista Dr Unit 402
- 117 Colchester Ave
- 0002-5 Edgewater Cir
- 0002-7 Edgewater Cir
- 0002-6 Edgewater Cir
- 00023 Edgewater Cir
- 0002-3 Edgewater Cir
- 00025 Edgewater Cir
- 40 Chatham Fields Rd
- 30 Chatham Fields Rd
- 34 Chatham Fields Rd
- 26 Chatham Fields Rd
- 44 Chatham Fields Rd
- 25 Edgerton St
- 5 Edgerton St
- 18 Chatham Fields Rd
- 20 Chatham Fields Rd
- 11 Huckleberry Acres Rd
- 38 Walnut Ave
- 33 Chatham Fields Rd
- 30 Walnut Ave
- 27 Chatham Fields Rd
- 39 Chatham Fields Rd
- 26 Walnut Ave
- 14 Chatham Fields Rd
- 47 Chatham Fields Rd
- 24 Walnut Ave
- 34 Walnut Ave