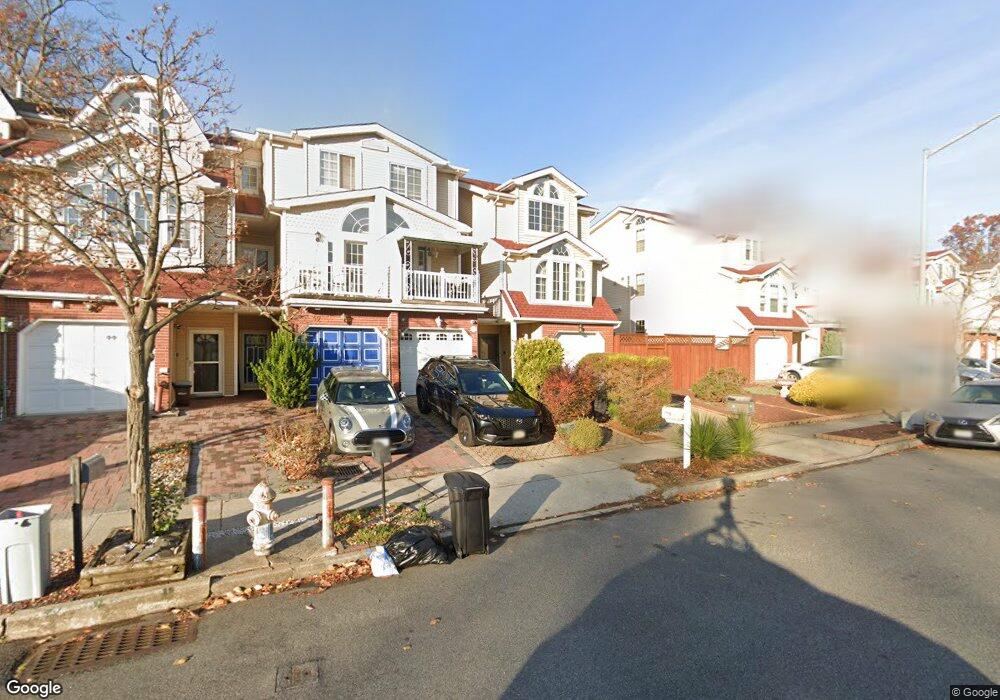
38 Chesebrough St Staten Island, NY 10312
Eltingville NeighborhoodEstimated Value: $653,000 - $835,000
3
Beds
3
Baths
2,176
Sq Ft
$344/Sq Ft
Est. Value
About This Home
This home is located at 38 Chesebrough St, Staten Island, NY 10312 and is currently estimated at $748,293, approximately $343 per square foot. 38 Chesebrough St is a home located in Richmond County with nearby schools including P.S. 42 The Eltingville School, I.S. 007 Elias Bernstein, and Tottenville High School.
Ownership History
Date
Name
Owned For
Owner Type
Purchase Details
Closed on
Mar 26, 2004
Sold by
Khoriakov Stanislav and Mirumyan Karina
Bought by
Lobatch Andrey and Lobatch Elena
Current Estimated Value
Home Financials for this Owner
Home Financials are based on the most recent Mortgage that was taken out on this home.
Original Mortgage
$304,880
Interest Rate
4.87%
Mortgage Type
New Conventional
Purchase Details
Closed on
Jan 24, 2000
Sold by
Meltser Maksim and Kantorovich Sofiya
Bought by
Khoriakov Stanislav and Mirumyan Karina
Home Financials for this Owner
Home Financials are based on the most recent Mortgage that was taken out on this home.
Original Mortgage
$211,500
Interest Rate
7.62%
Create a Home Valuation Report for This Property
The Home Valuation Report is an in-depth analysis detailing your home's value as well as a comparison with similar homes in the area
Home Values in the Area
Average Home Value in this Area
Purchase History
| Date | Buyer | Sale Price | Title Company |
|---|---|---|---|
| Lobatch Andrey | $381,100 | The Judicial Title Insurance | |
| Khoriakov Stanislav | $235,000 | Stewart Title Insurance Co |
Source: Public Records
Mortgage History
| Date | Status | Borrower | Loan Amount |
|---|---|---|---|
| Previous Owner | Lobatch Andrey | $304,880 | |
| Previous Owner | Khoriakov Stanislav | $211,500 | |
| Closed | Lobatch Andrey | $57,165 |
Source: Public Records
Tax History Compared to Growth
Tax History
| Year | Tax Paid | Tax Assessment Tax Assessment Total Assessment is a certain percentage of the fair market value that is determined by local assessors to be the total taxable value of land and additions on the property. | Land | Improvement |
|---|---|---|---|---|
| 2025 | $6,438 | $42,240 | $6,322 | $35,918 |
| 2024 | $6,438 | $36,300 | $6,941 | $29,359 |
| 2023 | $6,510 | $32,054 | $6,343 | $25,711 |
| 2022 | $6,351 | $38,700 | $7,860 | $30,840 |
| 2021 | $6,013 | $33,780 | $7,860 | $25,920 |
| 2020 | $5,697 | $33,900 | $7,860 | $26,040 |
| 2019 | $5,295 | $32,640 | $7,860 | $24,780 |
| 2018 | $5,148 | $26,712 | $7,260 | $19,452 |
| 2017 | $5,104 | $26,510 | $7,436 | $19,074 |
| 2016 | $4,690 | $25,010 | $7,497 | $17,513 |
| 2015 | $3,967 | $23,595 | $6,182 | $17,413 |
| 2014 | $3,967 | $22,260 | $6,540 | $15,720 |
Source: Public Records
Map
Nearby Homes
- 75 Chesebrough St
- 42 Sylvia St
- 47 Village Ln Unit B
- 160 Serrell Ave
- 632 Wilson Ave
- 6 Waimer Place
- 69 Stuyvesant Ave
- 420 Getz Ave
- 696 Katan Ave
- 15 Bovanizer St
- 219 Eltingville Blvd
- 4665 Amboy Rd
- 788 Katan Ave
- 229 Mosely Ave
- 376 Cortelyou Ave
- 717 Annadale Rd
- 280 Eltingville Blvd
- 284 Eltingville Blvd
- 288 Eltingville Blvd
- 102 Seguine Place
- 40 Chesebrough St
- 34 Chesebrough St
- 42 Chesebrough St
- 44 Chesebrough St
- 32 Chesebrough St
- 46 Chesebrough St
- 30 Chesebrough St
- 48 Chesebrough St
- 28 Chesebrough St
- 26 Chesebrough St
- 587 Wainwright Ave
- 599 Wainwright Ave
- 24 Chesebrough St
- 52 Chesebrough St
- 583 Wainwright Ave
- 22 Chesebrough St
- 603 Wainwright Ave
- 579 Wainwright Ave
- 56 Chesebrough St
- 56 Chesebrough St Unit Building