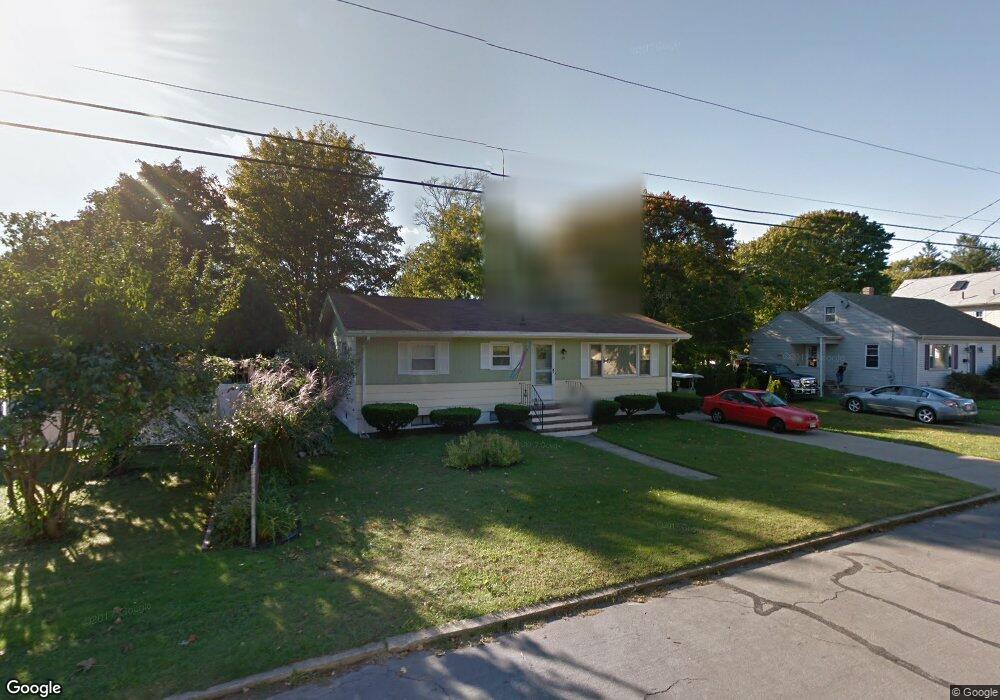
38 Chestnut St Fairhaven, MA 02719
Estimated Value: $431,000 - $566,000
3
Beds
2
Baths
1,092
Sq Ft
$457/Sq Ft
Est. Value
About This Home
This home is located at 38 Chestnut St, Fairhaven, MA 02719 and is currently estimated at $498,552, approximately $456 per square foot. 38 Chestnut St is a home located in Bristol County with nearby schools including Fairhaven High School, City On A Hill Charter Public School New Bedford, and St. Joseph School.
Ownership History
Date
Name
Owned For
Owner Type
Purchase Details
Closed on
Aug 22, 2007
Sold by
Lopez Ft and Lopez Floretta J
Bought by
Cardoza Gary G and Cardoza Jennifer L
Current Estimated Value
Home Financials for this Owner
Home Financials are based on the most recent Mortgage that was taken out on this home.
Original Mortgage
$183,750
Outstanding Balance
$116,519
Interest Rate
6.78%
Mortgage Type
Purchase Money Mortgage
Estimated Equity
$382,033
Purchase Details
Closed on
Apr 12, 2006
Sold by
Lopez Floretta J
Bought by
Lopez Ft and Lopez Floretta J
Purchase Details
Closed on
Dec 23, 1994
Sold by
Gertrude G Lopez Lt and Lopez Gertrude B
Bought by
Lopez Witfred J and Lopez Floretta
Home Financials for this Owner
Home Financials are based on the most recent Mortgage that was taken out on this home.
Original Mortgage
$60,000
Interest Rate
9.19%
Mortgage Type
Purchase Money Mortgage
Create a Home Valuation Report for This Property
The Home Valuation Report is an in-depth analysis detailing your home's value as well as a comparison with similar homes in the area
Home Values in the Area
Average Home Value in this Area
Purchase History
| Date | Buyer | Sale Price | Title Company |
|---|---|---|---|
| Cardoza Gary G | $245,000 | -- | |
| Lopez Ft | -- | -- | |
| Lopez Witfred J | $80,000 | -- |
Source: Public Records
Mortgage History
| Date | Status | Borrower | Loan Amount |
|---|---|---|---|
| Open | Lopez Witfred J | $183,750 | |
| Closed | Lopez Witfred J | $61,250 | |
| Previous Owner | Lopez Witfred J | $60,000 | |
| Previous Owner | Lopez Witfred J | $20,000 |
Source: Public Records
Tax History Compared to Growth
Tax History
| Year | Tax Paid | Tax Assessment Tax Assessment Total Assessment is a certain percentage of the fair market value that is determined by local assessors to be the total taxable value of land and additions on the property. | Land | Improvement |
|---|---|---|---|---|
| 2025 | $38 | $412,800 | $241,200 | $171,600 |
| 2024 | $3,609 | $391,000 | $241,200 | $149,800 |
| 2023 | $3,401 | $341,800 | $208,100 | $133,700 |
| 2022 | $3,179 | $311,100 | $189,500 | $121,600 |
| 2021 | $5,361 | $269,400 | $172,300 | $97,100 |
| 2020 | $2,980 | $269,400 | $172,300 | $97,100 |
| 2019 | $8,397 | $242,400 | $147,600 | $94,800 |
| 2018 | $4,390 | $230,300 | $140,500 | $89,800 |
| 2017 | $7,819 | $220,000 | $135,200 | $84,800 |
| 2016 | $2,591 | $212,700 | $132,500 | $80,200 |
| 2015 | $2,566 | $211,200 | $132,500 | $78,700 |
Source: Public Records
Map
Nearby Homes