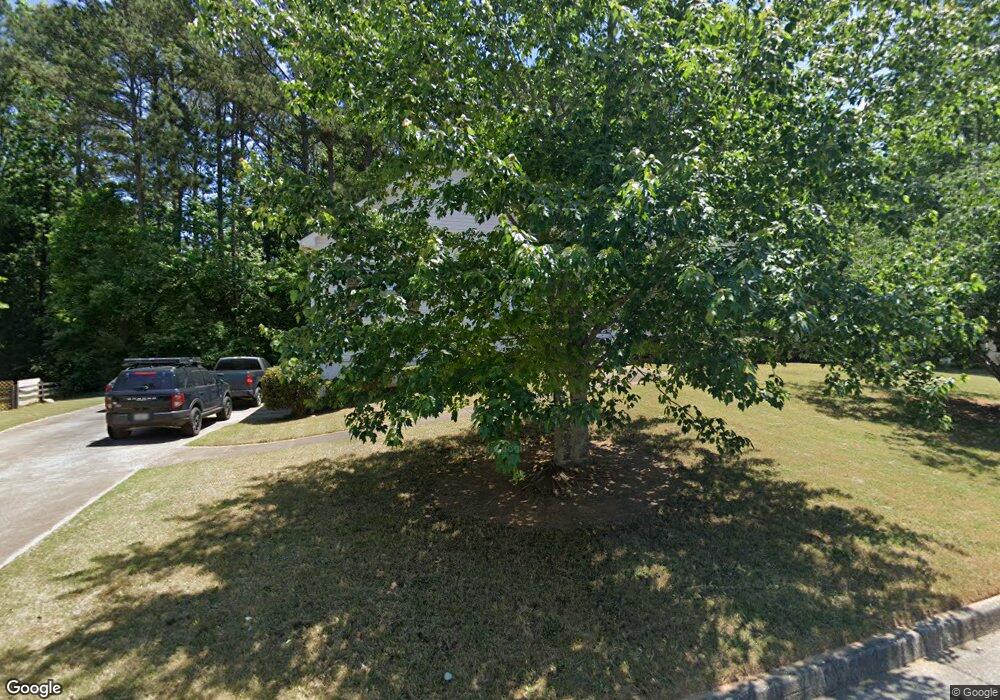
38 Colony Dr Dallas, GA 30132
Cedarcrest NeighborhoodEstimated Value: $310,000 - $373,000
3
Beds
2
Baths
1,540
Sq Ft
$223/Sq Ft
Est. Value
About This Home
This home is located at 38 Colony Dr, Dallas, GA 30132 and is currently estimated at $343,100, approximately $222 per square foot. 38 Colony Dr is a home located in Paulding County with nearby schools including W.C. Abney Elementary School, Lena Mae Moses Middle School, and North Paulding High School.
Ownership History
Date
Name
Owned For
Owner Type
Purchase Details
Closed on
Jan 9, 2023
Sold by
Entsminger Chad Madison
Bought by
Entsminger Chad Madison and Entsminger Patricia Lee
Current Estimated Value
Purchase Details
Closed on
Aug 31, 2011
Sold by
Secretary Of Housing And U
Bought by
Entsminger Chad M
Home Financials for this Owner
Home Financials are based on the most recent Mortgage that was taken out on this home.
Original Mortgage
$83,476
Interest Rate
4.62%
Mortgage Type
FHA
Purchase Details
Closed on
Jun 1, 2010
Sold by
Wells Fargo Bk Na
Bought by
Hud-Housing Of Urban Dev
Purchase Details
Closed on
Feb 14, 2003
Sold by
Scott Quality Homes Inc
Bought by
Lyday Marc and Lyday Jeanne
Home Financials for this Owner
Home Financials are based on the most recent Mortgage that was taken out on this home.
Original Mortgage
$134,500
Interest Rate
5.88%
Mortgage Type
FHA
Create a Home Valuation Report for This Property
The Home Valuation Report is an in-depth analysis detailing your home's value as well as a comparison with similar homes in the area
Home Values in the Area
Average Home Value in this Area
Purchase History
| Date | Buyer | Sale Price | Title Company |
|---|---|---|---|
| Entsminger Chad Madison | -- | -- | |
| Entsminger Chad M | $80,000 | -- | |
| Hud-Housing Of Urban Dev | -- | -- | |
| Wells Fargo Bk Na | $129,615 | -- | |
| Lyday Marc | $135,700 | -- |
Source: Public Records
Mortgage History
| Date | Status | Borrower | Loan Amount |
|---|---|---|---|
| Previous Owner | Entsminger Chad M | $83,476 | |
| Previous Owner | Lyday Marc | $134,500 |
Source: Public Records
Tax History Compared to Growth
Tax History
| Year | Tax Paid | Tax Assessment Tax Assessment Total Assessment is a certain percentage of the fair market value that is determined by local assessors to be the total taxable value of land and additions on the property. | Land | Improvement |
|---|---|---|---|---|
| 2024 | $3,282 | $135,196 | $12,000 | $123,196 |
| 2023 | $3,502 | $136,848 | $12,000 | $124,848 |
| 2022 | $2,884 | $112,512 | $12,000 | $100,512 |
| 2021 | $2,678 | $94,000 | $12,000 | $82,000 |
| 2020 | $2,427 | $83,560 | $12,000 | $71,560 |
| 2019 | $2,329 | $79,160 | $12,000 | $67,160 |
| 2018 | $2,017 | $68,800 | $10,000 | $58,800 |
| 2017 | $2,051 | $69,000 | $10,000 | $59,000 |
| 2016 | $1,806 | $61,600 | $10,000 | $51,600 |
| 2015 | $1,526 | $51,440 | $10,000 | $41,440 |
| 2014 | $1,676 | $54,960 | $10,000 | $44,960 |
| 2013 | -- | $47,080 | $10,000 | $37,080 |
Source: Public Records
Map
Nearby Homes
- 24 Colony Dr
- 62 Colony Dr
- 0 Colony Dr Unit 8856265
- 0 Colony Dr Unit 7162309
- 192 Richaven Place
- 184 Richaven Place
- 3985 Ivey Gulledge Rd
- 31 Colony Dr
- 198 Richaven Place
- 168 Richaven Place
- 710 Peach Crossing Dr
- 710 Peach Crossing Dr Unit 64
- 65 Colony Dr
- 722 Peach Crossing Dr
- 3997 Gulledge Rd
- 195 Richaven Place
- 144 Richaven Place
- 17 Navigator Ct
- 18 Lighthouse Dr
- 698 Peach Crossing Dr