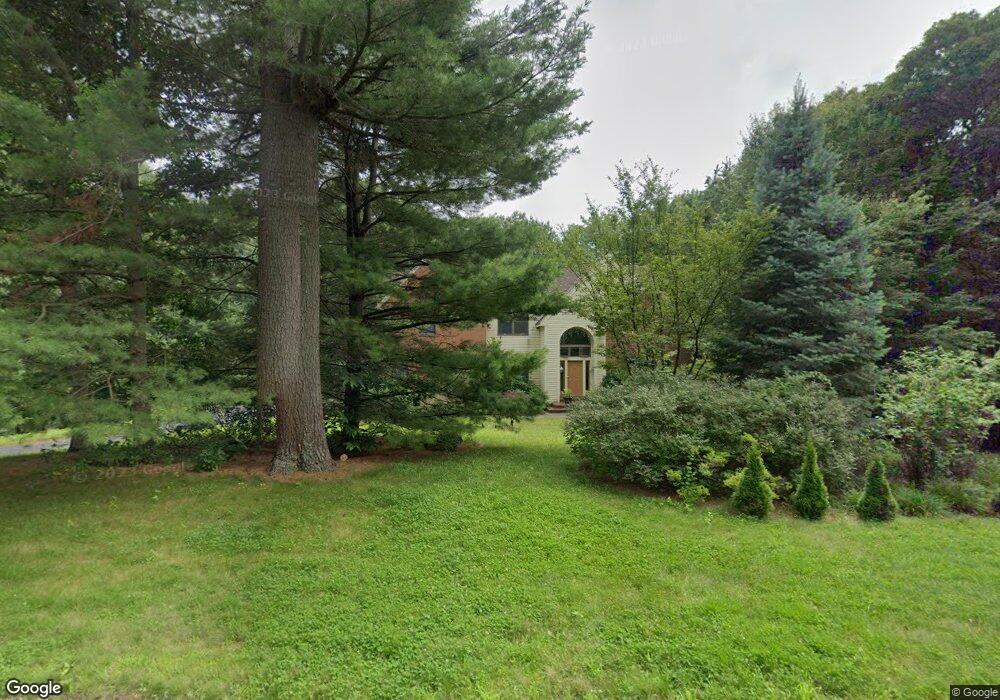
38 Columbus Rd Boylston, MA 01505
Estimated Value: $1,113,951 - $1,234,000
5
Beds
4
Baths
3,766
Sq Ft
$308/Sq Ft
Est. Value
About This Home
This home is located at 38 Columbus Rd, Boylston, MA 01505 and is currently estimated at $1,160,238, approximately $308 per square foot. 38 Columbus Rd is a home located in Worcester County with nearby schools including Tahanto Regional High School.
Ownership History
Date
Name
Owned For
Owner Type
Purchase Details
Closed on
Apr 18, 2008
Sold by
Fellows Douglas W and Fellows Rebecca N
Bought by
Johnson Matthew P and Pan Ning
Current Estimated Value
Home Financials for this Owner
Home Financials are based on the most recent Mortgage that was taken out on this home.
Original Mortgage
$488,000
Outstanding Balance
$311,218
Interest Rate
6.1%
Mortgage Type
Purchase Money Mortgage
Estimated Equity
$849,020
Purchase Details
Closed on
Apr 29, 2004
Sold by
Kulkarni Rama S
Bought by
Fellows Douglas W and Fellows Rebecca N
Home Financials for this Owner
Home Financials are based on the most recent Mortgage that was taken out on this home.
Original Mortgage
$545,000
Interest Rate
5.36%
Mortgage Type
Purchase Money Mortgage
Purchase Details
Closed on
Oct 28, 1994
Sold by
Shrewsbury Homes Inc
Bought by
Kulkarni Shankar J and Kulkarni Rama
Create a Home Valuation Report for This Property
The Home Valuation Report is an in-depth analysis detailing your home's value as well as a comparison with similar homes in the area
Home Values in the Area
Average Home Value in this Area
Purchase History
| Date | Buyer | Sale Price | Title Company |
|---|---|---|---|
| Johnson Matthew P | $610,000 | -- | |
| Fellows Douglas W | $695,000 | -- | |
| Kulkarni Shankar J | $82,000 | -- |
Source: Public Records
Mortgage History
| Date | Status | Borrower | Loan Amount |
|---|---|---|---|
| Open | Johnson Matthew P | $488,000 | |
| Previous Owner | Fellows Douglas W | $545,000 | |
| Previous Owner | Kulkarni Shankar J | $196,550 | |
| Previous Owner | Kulkarni Shankar J | $200,750 | |
| Previous Owner | Kulkarni Shankar J | $202,500 | |
| Previous Owner | Kulkarni Shankar J | $227,000 |
Source: Public Records
Tax History Compared to Growth
Tax History
| Year | Tax Paid | Tax Assessment Tax Assessment Total Assessment is a certain percentage of the fair market value that is determined by local assessors to be the total taxable value of land and additions on the property. | Land | Improvement |
|---|---|---|---|---|
| 2025 | $12,797 | $925,300 | $227,800 | $697,500 |
| 2024 | $11,962 | $866,200 | $227,800 | $638,400 |
| 2023 | $10,598 | $736,000 | $200,200 | $535,800 |
| 2022 | $11,658 | $736,000 | $200,200 | $535,800 |
| 2021 | $5,562 | $701,500 | $200,200 | $501,300 |
| 2020 | $11,550 | $698,300 | $199,800 | $498,500 |
| 2019 | $195 | $673,800 | $198,200 | $475,600 |
| 2018 | $0 | $651,400 | $198,200 | $453,200 |
| 2017 | $0 | $651,400 | $198,200 | $453,200 |
| 2016 | $10,274 | $627,600 | $178,200 | $449,400 |
| 2015 | $10,927 | $627,600 | $178,200 | $449,400 |
| 2014 | $10,316 | $593,200 | $165,000 | $428,200 |
Source: Public Records
Map
Nearby Homes
- 48 Perry Rd
- 70 Colonial Dr
- 18 Bay Path Dr
- 106 Reservoir St
- 20 Rawson Hill Dr
- 11 Cranbrook Rd
- 5 Sewall St Unit 259
- 7-11 Reservoir St
- 25 Castle Rd
- 28 Camelot Dr
- 20 Olde Colony Dr
- 21 School St
- 9 Morningside Dr
- 207 Edgebrook Dr Unit 2-11
- 217 Edgebrook Dr
- 35 Woodstone Rd
- 11 Country Way
- 33 Woodstone Rd
- 2 Harmony Ln Unit 1
- 7 Oakwood Cir Unit 15