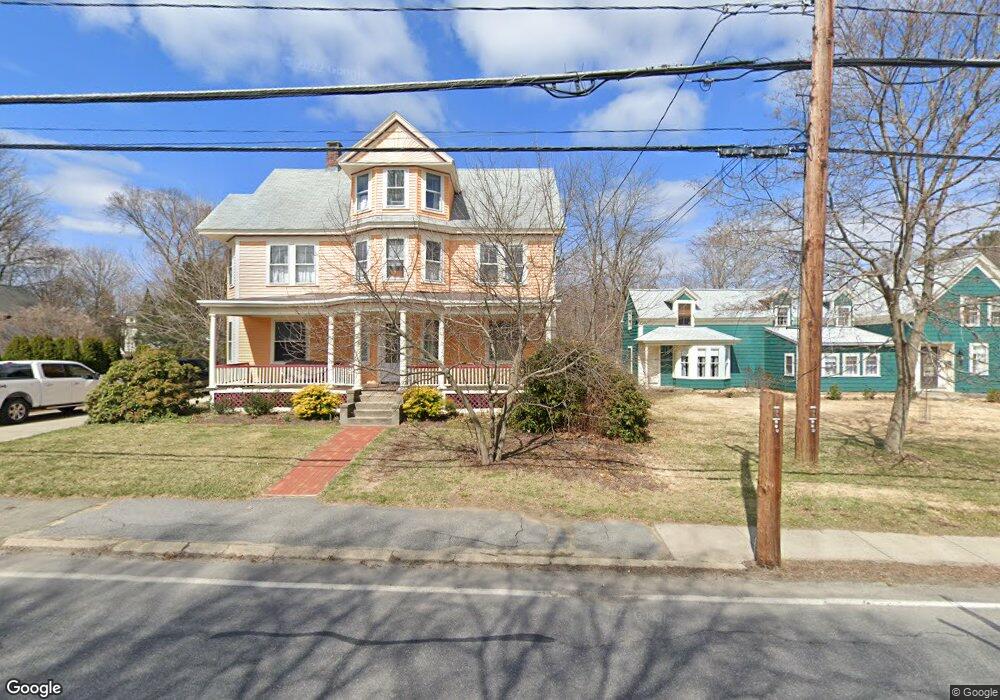
38 Concord St Maynard, MA 01754
Estimated Value: $522,000 - $640,747
6
Beds
2
Baths
2,183
Sq Ft
$269/Sq Ft
Est. Value
About This Home
This home is located at 38 Concord St, Maynard, MA 01754 and is currently estimated at $588,187, approximately $269 per square foot. 38 Concord St is a home located in Middlesex County with nearby schools including Green Meadow School, Fowler School, and Maynard High School.
Ownership History
Date
Name
Owned For
Owner Type
Purchase Details
Closed on
Sep 20, 2023
Sold by
Markham Rt and Scheiner
Bought by
Paul C Scheiner T C and Paul Scheiner
Current Estimated Value
Purchase Details
Closed on
Jun 23, 2014
Sold by
Scheiner Paul and Scheiner Mary A
Bought by
Markahm Rt and Scheiner
Purchase Details
Closed on
Feb 20, 1987
Sold by
Byrne Ann
Bought by
Scheiner Paul
Home Financials for this Owner
Home Financials are based on the most recent Mortgage that was taken out on this home.
Original Mortgage
$30,000
Interest Rate
9.24%
Mortgage Type
Purchase Money Mortgage
Create a Home Valuation Report for This Property
The Home Valuation Report is an in-depth analysis detailing your home's value as well as a comparison with similar homes in the area
Home Values in the Area
Average Home Value in this Area
Purchase History
| Date | Buyer | Sale Price | Title Company |
|---|---|---|---|
| Paul C Scheiner T C | -- | None Available | |
| Markahm Rt | -- | -- | |
| Scheiner Paul | $94,000 | -- |
Source: Public Records
Mortgage History
| Date | Status | Borrower | Loan Amount |
|---|---|---|---|
| Previous Owner | Scheiner Paul | $30,000 |
Source: Public Records
Tax History
| Year | Tax Paid | Tax Assessment Tax Assessment Total Assessment is a certain percentage of the fair market value that is determined by local assessors to be the total taxable value of land and additions on the property. | Land | Improvement |
|---|---|---|---|---|
| 2025 | $9,115 | $511,200 | $282,400 | $228,800 |
| 2024 | $8,899 | $497,700 | $268,900 | $228,800 |
| 2023 | $8,941 | $471,300 | $256,100 | $215,200 |
| 2022 | $8,832 | $430,400 | $215,200 | $215,200 |
| 2021 | $8,475 | $420,600 | $215,200 | $205,400 |
| 2020 | $8,258 | $400,100 | $194,700 | $205,400 |
| 2019 | $7,619 | $362,100 | $186,000 | $176,100 |
| 2018 | $7,152 | $315,900 | $169,000 | $146,900 |
| 2017 | $6,953 | $315,900 | $169,000 | $146,900 |
| 2016 | $7,168 | $337,300 | $169,000 | $168,300 |
| 2015 | $7,505 | $336,400 | $161,400 | $175,000 |
| 2014 | $7,639 | $342,700 | $156,200 | $186,500 |
Source: Public Records
Map
Nearby Homes
- 12 Brown St
- 36 Brown St
- 66 Powder Mill Rd
- 68 Powder Mill Rd
- 22 Douglas Ave Unit 2
- 22 Douglas Ave Unit 1
- 70 Powder Mill Rd
- 13 Arthur St Unit 15
- 5 Hayes St Unit 5
- 63 Conant St
- 153 Summer St
- 31-33 Roosevelt St
- 10 Mill St Unit B
- 23 Deer Path Unit 5
- 41 Taylor Rd
- 1 Drummer Rd Unit A5
- 30 Brewster Ln
- 96 Forest Ridge Rd Unit 96
- 40 High St
- 128 Parker St Unit 3B
Your Personal Tour Guide
Ask me questions while you tour the home.