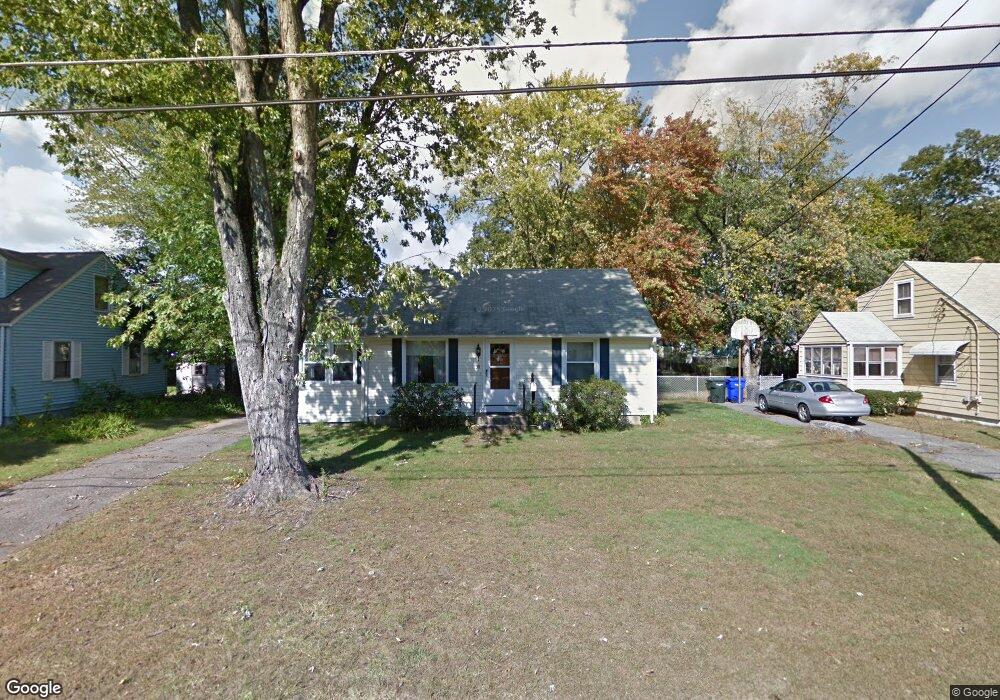
38 Curve St Springfield, MA 01104
East Springfield NeighborhoodEstimated Value: $212,000 - $234,336
2
Beds
1
Bath
720
Sq Ft
$313/Sq Ft
Est. Value
About This Home
This home is located at 38 Curve St, Springfield, MA 01104 and is currently estimated at $225,084, approximately $312 per square foot. 38 Curve St is a home located in Hampden County with nearby schools including Daniel B Brunton, John F. Kennedy Academy, and Springfield Central High School.
Ownership History
Date
Name
Owned For
Owner Type
Purchase Details
Closed on
Nov 27, 2001
Sold by
Oyler Gail A
Bought by
Delonardis Angela
Current Estimated Value
Home Financials for this Owner
Home Financials are based on the most recent Mortgage that was taken out on this home.
Original Mortgage
$63,341
Outstanding Balance
$24,879
Interest Rate
6.64%
Mortgage Type
Purchase Money Mortgage
Estimated Equity
$200,205
Create a Home Valuation Report for This Property
The Home Valuation Report is an in-depth analysis detailing your home's value as well as a comparison with similar homes in the area
Home Values in the Area
Average Home Value in this Area
Purchase History
| Date | Buyer | Sale Price | Title Company |
|---|---|---|---|
| Delonardis Angela | $65,300 | -- |
Source: Public Records
Mortgage History
| Date | Status | Borrower | Loan Amount |
|---|---|---|---|
| Open | Delonardis Angela | $63,341 |
Source: Public Records
Tax History Compared to Growth
Tax History
| Year | Tax Paid | Tax Assessment Tax Assessment Total Assessment is a certain percentage of the fair market value that is determined by local assessors to be the total taxable value of land and additions on the property. | Land | Improvement |
|---|---|---|---|---|
| 2025 | $3,053 | $194,700 | $38,700 | $156,000 |
| 2024 | $2,777 | $172,900 | $38,700 | $134,200 |
| 2023 | $2,866 | $168,100 | $36,100 | $132,000 |
| 2022 | $2,774 | $147,400 | $33,700 | $113,700 |
| 2021 | $2,408 | $127,400 | $30,700 | $96,700 |
| 2020 | $2,389 | $122,300 | $30,700 | $91,600 |
| 2019 | $2,098 | $106,600 | $31,700 | $74,900 |
| 2018 | $2,123 | $107,900 | $31,700 | $76,200 |
| 2017 | $2,155 | $109,600 | $28,700 | $80,900 |
| 2016 | $2,082 | $105,900 | $28,700 | $77,200 |
| 2015 | $1,920 | $97,600 | $28,700 | $68,900 |
Source: Public Records
Map
Nearby Homes