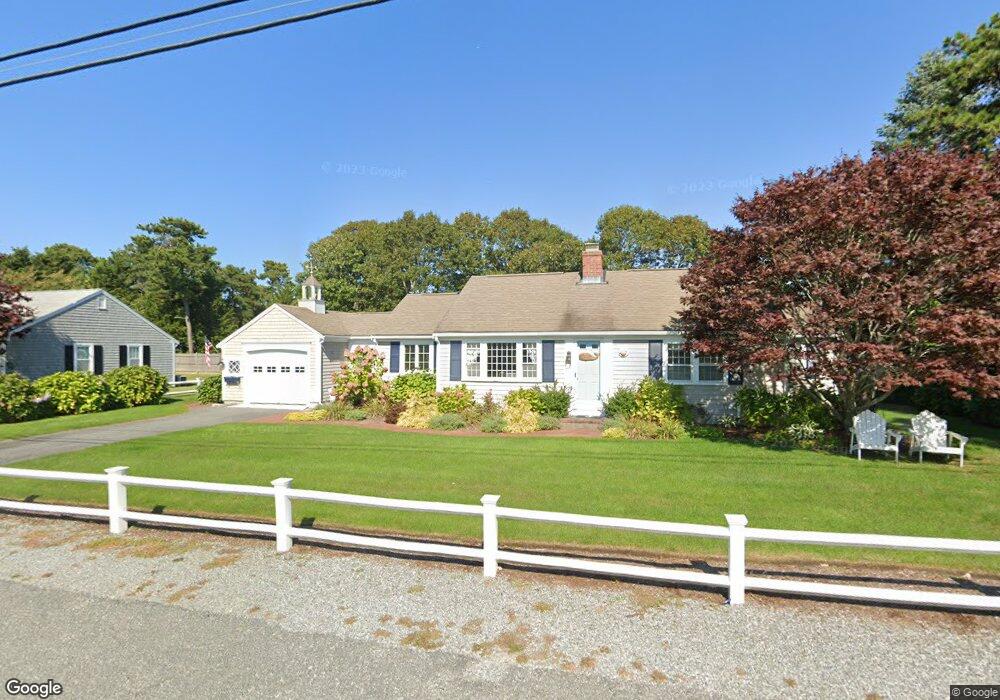
38 Davenport Rd West Dennis, MA 02670
West Dennis NeighborhoodEstimated Value: $1,124,000 - $1,217,948
2
Beds
2
Baths
1,201
Sq Ft
$965/Sq Ft
Est. Value
About This Home
This home is located at 38 Davenport Rd, West Dennis, MA 02670 and is currently estimated at $1,158,737, approximately $964 per square foot. 38 Davenport Rd is a home located in Barnstable County with nearby schools including Dennis-Yarmouth Regional High School and St. Pius X. School.
Ownership History
Date
Name
Owned For
Owner Type
Purchase Details
Closed on
Dec 21, 2018
Sold by
Farrell Thomas K and Farrell Linda J
Bought by
Farrell Ryan M
Current Estimated Value
Home Financials for this Owner
Home Financials are based on the most recent Mortgage that was taken out on this home.
Original Mortgage
$400,000
Outstanding Balance
$353,112
Interest Rate
4.9%
Mortgage Type
New Conventional
Estimated Equity
$805,625
Purchase Details
Closed on
Jul 30, 1993
Sold by
Petralias Alexandria
Bought by
Farrell Thomas K and Farrell Linda J
Create a Home Valuation Report for This Property
The Home Valuation Report is an in-depth analysis detailing your home's value as well as a comparison with similar homes in the area
Home Values in the Area
Average Home Value in this Area
Purchase History
| Date | Buyer | Sale Price | Title Company |
|---|---|---|---|
| Farrell Ryan M | $600,000 | -- | |
| Farrell Ryan M | $600,000 | -- | |
| Farrell Thomas K | $150,000 | -- | |
| Farrell Thomas K | $150,000 | -- |
Source: Public Records
Mortgage History
| Date | Status | Borrower | Loan Amount |
|---|---|---|---|
| Open | Farrell Ryan M | $400,000 | |
| Closed | Farrell Ryan M | $400,000 | |
| Previous Owner | Farrell Thomas K | $98,000 | |
| Previous Owner | Farrell Thomas K | $75,000 | |
| Previous Owner | Farrell Thomas K | $75,000 |
Source: Public Records
Tax History Compared to Growth
Tax History
| Year | Tax Paid | Tax Assessment Tax Assessment Total Assessment is a certain percentage of the fair market value that is determined by local assessors to be the total taxable value of land and additions on the property. | Land | Improvement |
|---|---|---|---|---|
| 2025 | $4,834 | $1,116,400 | $535,900 | $580,500 |
| 2024 | $4,686 | $1,067,400 | $515,400 | $552,000 |
| 2023 | $4,532 | $970,400 | $468,500 | $501,900 |
| 2022 | $4,229 | $755,200 | $379,900 | $375,300 |
| 2021 | $4,316 | $715,700 | $372,400 | $343,300 |
| 2020 | $4,065 | $666,400 | $354,700 | $311,700 |
| 2019 | $3,801 | $616,000 | $347,700 | $268,300 |
| 2018 | $3,645 | $574,900 | $331,000 | $243,900 |
| 2017 | $3,488 | $567,100 | $331,000 | $236,100 |
| 2016 | $3,589 | $549,600 | $347,600 | $202,000 |
| 2015 | $3,517 | $549,600 | $347,600 | $202,000 |
| 2014 | $3,315 | $522,000 | $320,000 | $202,000 |
Source: Public Records
Map
Nearby Homes
- 251 Old Main St
- 181 Pleasant St
- 22 Beach View Rd
- 308 Old Main St
- 141 Main St Unit 4
- 141 Main St Unit 23
- 14 Schoolhouse Ln
- 209 Main St Unit 5
- 209 Main St Unit 6
- 209 Main St Unit 4
- 209 Main St Unit 3
- 209 Main St Unit 2
- 209 Main St Unit 1
- 45 Seth Ln
- 22 Powhatan Rd
- 23 Doric Ave
- 178 School St
- 61 Station Ave
- 7 Wood Rd
- 29 Bass River Rd
- 32 Davenport Rd
- 42 Davenport Rd
- 37 Old Field Rd
- 37 Davenport Rd
- 33 Davenport Rd
- 43 Davenport Rd
- 28 Davenport Rd
- 48 Davenport Rd
- 31 Old Field Rd
- 27 Davenport Rd
- 49 Old Field Rd
- 36 Garfield Ln
- 32 Garfield Ln
- 47 Davenport Rd
- 42 Garfield Ln
- 28 Garfield Ln
- 22 Davenport Rd
- 23 Davenport Rd
- 25 Old Field Rd
- 38 Old Field Rd