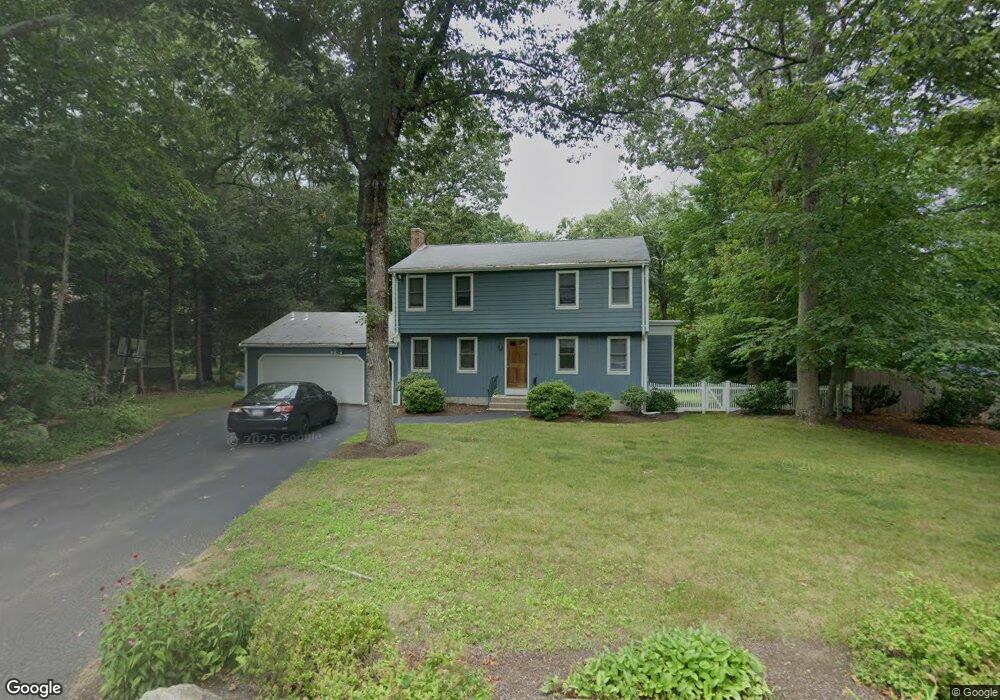
38 Deborah Sampson St Sharon, MA 02067
Estimated Value: $1,107,000 - $1,352,000
4
Beds
4
Baths
2,976
Sq Ft
$395/Sq Ft
Est. Value
About This Home
This home is located at 38 Deborah Sampson St, Sharon, MA 02067 and is currently estimated at $1,174,265, approximately $394 per square foot. 38 Deborah Sampson St is a home located in Norfolk County with nearby schools including Cottage Street Elementary School, Sharon Middle School, and Sharon High School.
Ownership History
Date
Name
Owned For
Owner Type
Purchase Details
Closed on
Jul 11, 2025
Sold by
Spellman Roger and Spellman Marcia E
Bought by
Roger Spellman 2024 Ft and Spellman
Current Estimated Value
Purchase Details
Closed on
Jan 11, 1989
Sold by
Levine Stephen M
Bought by
Spellman Roger
Create a Home Valuation Report for This Property
The Home Valuation Report is an in-depth analysis detailing your home's value as well as a comparison with similar homes in the area
Home Values in the Area
Average Home Value in this Area
Purchase History
| Date | Buyer | Sale Price | Title Company |
|---|---|---|---|
| Roger Spellman 2024 Ft | -- | -- | |
| Spellman Roger | $228,000 | -- | |
| Spellman Roger | $228,000 | -- |
Source: Public Records
Mortgage History
| Date | Status | Borrower | Loan Amount |
|---|---|---|---|
| Previous Owner | Spellman Roger | $280,000 | |
| Previous Owner | Spellman Roger | $227,150 |
Source: Public Records
Tax History Compared to Growth
Tax History
| Year | Tax Paid | Tax Assessment Tax Assessment Total Assessment is a certain percentage of the fair market value that is determined by local assessors to be the total taxable value of land and additions on the property. | Land | Improvement |
|---|---|---|---|---|
| 2025 | $15,181 | $868,500 | $443,300 | $425,200 |
| 2024 | $14,563 | $828,400 | $406,700 | $421,700 |
| 2023 | $14,260 | $767,100 | $380,200 | $386,900 |
| 2022 | $13,554 | $686,300 | $316,800 | $369,500 |
| 2021 | $13,443 | $658,000 | $298,900 | $359,100 |
| 2020 | $12,502 | $658,000 | $298,900 | $359,100 |
| 2019 | $12,374 | $637,500 | $278,400 | $359,100 |
| 2018 | $12,240 | $631,900 | $272,800 | $359,100 |
| 2017 | $12,049 | $614,100 | $255,000 | $359,100 |
| 2016 | $11,712 | $582,400 | $255,000 | $327,400 |
| 2015 | $11,478 | $565,400 | $237,700 | $327,700 |
| 2014 | $10,635 | $517,500 | $216,200 | $301,300 |
Source: Public Records
Map
Nearby Homes
- 49 Cottage St
- 15 Paul Revere Rd
- 137 Pond St
- 32 Billings St Unit A
- 40 Lyndon Rd
- 47 Ashcroft Rd
- 5 Trowel Pond Shop Rd Unit C
- 148 S Main St
- 29 Station St
- 7 Ashcroft Rd
- 16 Forest Rd
- 54 Depot St
- 30 Hampton Rd
- 136 N Main St
- 6 Tall Tree Rd
- 2 Rhodes Ave
- 3 Trowel Shop Pond Rd Unit 3
- 20 Trowel Shop Pond Rd Unit 24
- 16 Trowel Shop Pond Rd Unit 16
- 2 Trowel Shop Pond Rd Unit 2
- 44 Deborah Sampson St
- 32 Deborah Sampson St
- 50 Deborah Sampson St
- 43 Deborah Sampson St
- 35 Deborah Sampson St
- 24 Deborah Sampson St
- 51 Deborah Sampson St
- 29 Deborah Sampson St
- 54 Deborah Sampson St
- 5 Lothrup Way
- 25 Deborah Sampson St
- 4 Lothrup Way
- 20 Deborah Sampson St
- 58 Deborah Sampson St
- 18 Manns Hill Crescent
- 12 Knife Shop Ln
- 21 Deborah Sampson St
- 6 Lothrup Way
- 16 Deborah Sampson St
- 7 Lothrup Way