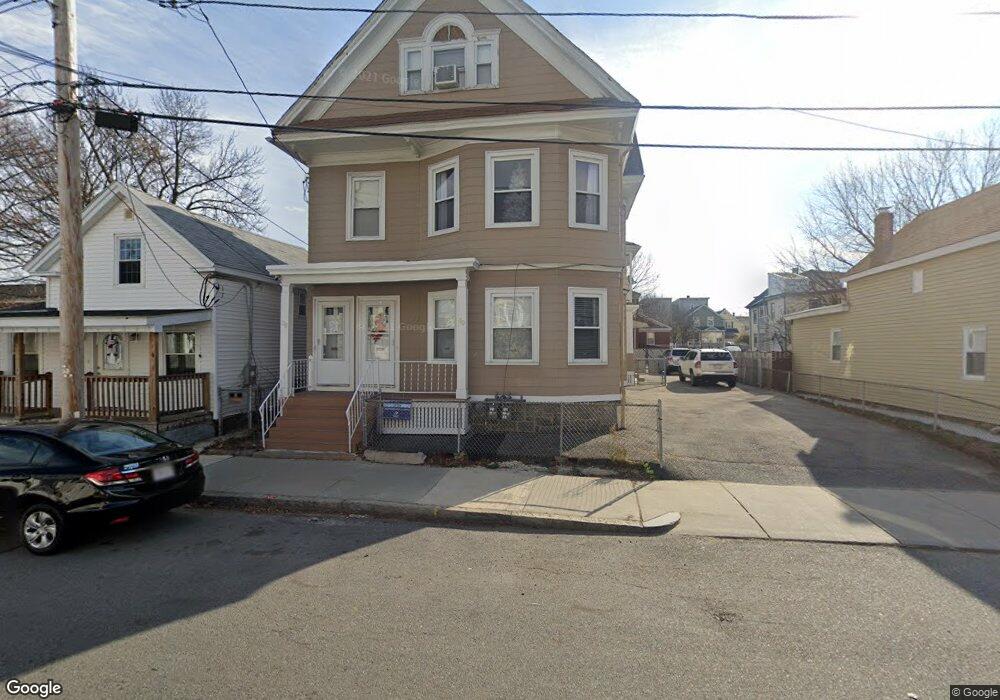
38 Durham St Unit 40 Lawrence, MA 01843
South West NeighborhoodEstimated Value: $722,136 - $878,000
4
Beds
2
Baths
2,692
Sq Ft
$291/Sq Ft
Est. Value
About This Home
This home is located at 38 Durham St Unit 40, Lawrence, MA 01843 and is currently estimated at $782,534, approximately $290 per square foot. 38 Durham St Unit 40 is a home located in Essex County with nearby schools including South Terrace Elementary School, Olive Branch Elementary School, and John Breen School.
Ownership History
Date
Name
Owned For
Owner Type
Purchase Details
Closed on
Feb 13, 2009
Sold by
Moll Jeffrey B
Bought by
Cuevas Franklin J
Current Estimated Value
Home Financials for this Owner
Home Financials are based on the most recent Mortgage that was taken out on this home.
Original Mortgage
$158,850
Outstanding Balance
$101,269
Interest Rate
5.26%
Mortgage Type
Purchase Money Mortgage
Estimated Equity
$681,265
Purchase Details
Closed on
Dec 17, 2008
Sold by
Vasquez Roselin
Bought by
Cris Investments Llc
Home Financials for this Owner
Home Financials are based on the most recent Mortgage that was taken out on this home.
Original Mortgage
$158,850
Outstanding Balance
$101,269
Interest Rate
5.26%
Mortgage Type
Purchase Money Mortgage
Estimated Equity
$681,265
Purchase Details
Closed on
Jul 29, 2005
Sold by
Desjardins Claire I and Lemieux Pamela
Bought by
Vasquez Roselin
Home Financials for this Owner
Home Financials are based on the most recent Mortgage that was taken out on this home.
Original Mortgage
$288,000
Interest Rate
5.67%
Mortgage Type
Purchase Money Mortgage
Create a Home Valuation Report for This Property
The Home Valuation Report is an in-depth analysis detailing your home's value as well as a comparison with similar homes in the area
Home Values in the Area
Average Home Value in this Area
Purchase History
| Date | Buyer | Sale Price | Title Company |
|---|---|---|---|
| Cuevas Franklin J | $176,500 | -- | |
| Cris Investments Llc | $107,000 | -- | |
| Vasquez Roselin | $360,000 | -- |
Source: Public Records
Mortgage History
| Date | Status | Borrower | Loan Amount |
|---|---|---|---|
| Open | Cuevas Franklin J | $158,850 | |
| Previous Owner | Vasquez Roselin | $288,000 |
Source: Public Records
Tax History Compared to Growth
Tax History
| Year | Tax Paid | Tax Assessment Tax Assessment Total Assessment is a certain percentage of the fair market value that is determined by local assessors to be the total taxable value of land and additions on the property. | Land | Improvement |
|---|---|---|---|---|
| 2025 | $5,898 | $670,200 | $100,800 | $569,400 |
| 2024 | $5,738 | $620,300 | $109,100 | $511,200 |
| 2023 | $5,566 | $547,800 | $101,200 | $446,600 |
| 2022 | $5,164 | $451,400 | $91,700 | $359,700 |
| 2021 | $5,020 | $409,100 | $91,700 | $317,400 |
| 2020 | $4,828 | $388,400 | $87,000 | $301,400 |
| 2019 | $4,367 | $319,200 | $72,200 | $247,000 |
| 2018 | $3,991 | $278,700 | $68,400 | $210,300 |
| 2017 | $3,694 | $240,800 | $64,600 | $176,200 |
| 2016 | $3,623 | $233,600 | $53,200 | $180,400 |
| 2015 | $3,555 | $235,100 | $53,200 | $181,900 |
Source: Public Records
Map
Nearby Homes
- 41 Durham St
- 13 Kingston St
- 132-134 S Broadway
- 19 Front St
- 91-93 Newton St
- 82 S Broadway
- 49 Bowdoin St Unit 51
- 629 Andover St
- 12 Merrimack View Ct
- 8 Packard St
- 91 Farnham St
- 55-59 Water St
- 82 Water St
- 37 Tewksbury St Unit 39
- 54 Amherst St
- 312 Water St Unit 36
- 15 Beaconsfield St
- 27-29 Dorchester St
- 11 W Hawley St
- 24 Inman St Unit 32
- 36 Durham St
- 38-40 Durham St
- 47 Durham St
- 43 Durham St Unit 47
- 44 Durham St
- 37 Durham St
- 31 Durham St
- 31 Durham St Unit 1,1
- 31 Durham St Unit 3,1
- 64 Newton St Unit 66
- 51 Newton St
- 37 Atkinson St
- 37 Atkinson St Unit 1
- 46 Newton St
- 46 Newton St Unit A
- 18 Durham St Unit 22
- 41 Atkinson St
- 27 Durham St
- 30 Kingston St
- 45 Newton St