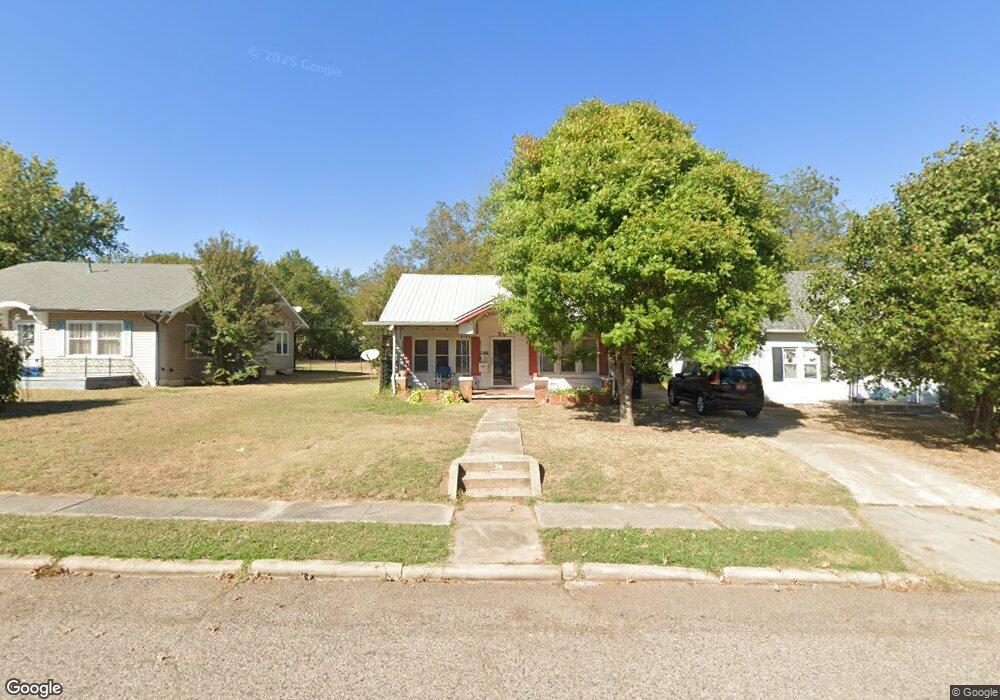
38 E Drummond St Shawnee, OK 74801
Estimated Value: $92,414 - $114,000
3
Beds
1
Bath
1,204
Sq Ft
$86/Sq Ft
Est. Value
About This Home
This home is located at 38 E Drummond St, Shawnee, OK 74801 and is currently estimated at $103,354, approximately $85 per square foot. 38 E Drummond St is a home located in Pottawatomie County with nearby schools including Sequoyah Elementary School, Shawnee Middle School, and Shawnee High School.
Ownership History
Date
Name
Owned For
Owner Type
Purchase Details
Closed on
Jul 2, 2015
Sold by
Dibler Celeste Barbara
Bought by
Gault John Byron
Current Estimated Value
Purchase Details
Closed on
Jul 6, 2012
Sold by
Gault John Byron
Bought by
Dibler Barbara Celeste
Home Financials for this Owner
Home Financials are based on the most recent Mortgage that was taken out on this home.
Original Mortgage
$68,000
Interest Rate
3.81%
Mortgage Type
Seller Take Back
Purchase Details
Closed on
Mar 31, 2009
Sold by
Smith Brandon
Bought by
Gault John
Purchase Details
Closed on
May 10, 2006
Sold by
Carpenter Jana L
Bought by
Smith Brandon
Home Financials for this Owner
Home Financials are based on the most recent Mortgage that was taken out on this home.
Original Mortgage
$62,000
Interest Rate
6.36%
Mortgage Type
Stand Alone First
Purchase Details
Closed on
May 2, 2002
Sold by
Daugherty Samuel and Daugherty Linda
Bought by
Carpenter Jana L
Create a Home Valuation Report for This Property
The Home Valuation Report is an in-depth analysis detailing your home's value as well as a comparison with similar homes in the area
Purchase History
| Date | Buyer | Sale Price | Title Company |
|---|---|---|---|
| Gault John Byron | -- | None Available | |
| Dibler Barbara Celeste | -- | None Available | |
| Gault John | -- | None Available | |
| Smith Brandon | $62,000 | None Available | |
| Carpenter Jana L | $56,000 | -- |
Source: Public Records
Mortgage History
| Date | Status | Borrower | Loan Amount |
|---|---|---|---|
| Previous Owner | Dibler Barbara Celeste | $68,000 | |
| Previous Owner | Smith Brandon | $62,000 |
Source: Public Records
Tax History
| Year | Tax Paid | Tax Assessment Tax Assessment Total Assessment is a certain percentage of the fair market value that is determined by local assessors to be the total taxable value of land and additions on the property. | Land | Improvement |
|---|---|---|---|---|
| 2025 | $730 | $7,443 | $294 | $7,149 |
| 2023 | $705 | $6,751 | $294 | $6,457 |
| 2022 | $693 | $6,751 | $294 | $6,457 |
| 2021 | $688 | $6,825 | $294 | $6,531 |
| 2020 | $715 | $7,076 | $294 | $6,782 |
| 2019 | $752 | $7,201 | $294 | $6,907 |
| 2018 | $731 | $7,147 | $294 | $6,853 |
| 2017 | $746 | $7,391 | $294 | $7,097 |
| 2016 | $769 | $7,539 | $294 | $7,245 |
| 2015 | $677 | $7,769 | $294 | $7,475 |
| 2014 | $654 | $7,543 | $273 | $7,270 |
Source: Public Records
Map
Nearby Homes
- 1102 N Park Ave
- 1510 N Union Ave
- 824 N Union Ave
- 902 N Beard Ave
- 0 Independence and Minnesota St
- 1607 N Beard Ave
- 1617 N Beard St
- 1432 N Park Ave
- 1108 N Pennsylvania Ave
- 434 E Wallace St
- 1505 N Louisa Ave
- 819 N Park Ave
- 204 W Wallace St
- 110 E Dewey St
- 210 E Cammack
- 1805 N Philadelphia Ave
- 545 W Poplar St
- 1815 N Bell Ave
- 1822 N Philadelphia Ave
- 1002 Jefferson Place
- 42 E Drummond St
- 36 E Drummond St
- 30 E Drummond St
- 1204 N Union Ave
- 22 E Drummond St
- 29 E Severn St
- 27 E Severn St
- 50 E Drummond St
- 48 E Drummond St
- 1212 N Union Ave
- 23 E Severn St
- 45 E Drummond St
- 21 E Severn St
- 41 E Drummond St
- 29 E Drummond St
- 1203 N Union Ave
- 1205 N Union Ave
- 27 E Drummond St
- 19 E Severn St
- 1133 N Union Ave
Your Personal Tour Guide
Ask me questions while you tour the home.