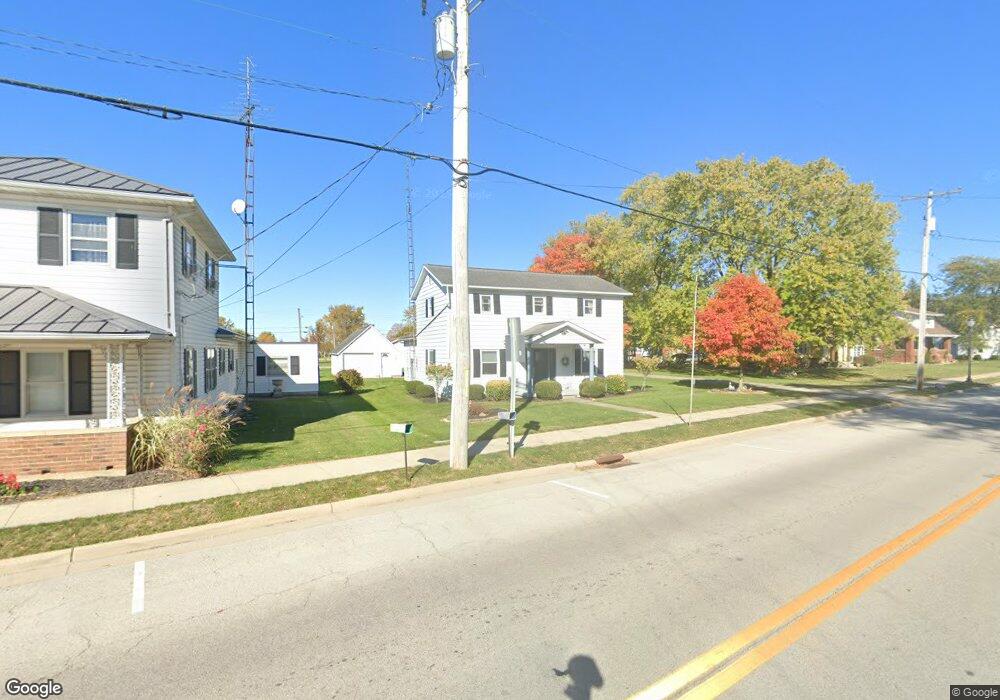
38 E Main St Osgood, OH 45351
Estimated Value: $230,000 - $281,000
3
Beds
2
Baths
1,960
Sq Ft
$129/Sq Ft
Est. Value
About This Home
This home is located at 38 E Main St, Osgood, OH 45351 and is currently estimated at $253,400, approximately $129 per square foot. 38 E Main St is a home with nearby schools including Marion Local Elementary School and Marion Local High School.
Ownership History
Date
Name
Owned For
Owner Type
Purchase Details
Closed on
Nov 27, 2017
Sold by
Brunswick Marianne M T
Bought by
Marianne M T Brunswick and O.D.
Current Estimated Value
Purchase Details
Closed on
Dec 2, 2008
Sold by
Estate Of Maurice R Brunswick
Bought by
Brunswick Marianne M
Create a Home Valuation Report for This Property
The Home Valuation Report is an in-depth analysis detailing your home's value as well as a comparison with similar homes in the area
Purchase History
| Date | Buyer | Sale Price | Title Company |
|---|---|---|---|
| Marianne M T Brunswick | -- | -- | |
| Brunswick Marianne M | -- | None Available |
Source: Public Records
Tax History
| Year | Tax Paid | Tax Assessment Tax Assessment Total Assessment is a certain percentage of the fair market value that is determined by local assessors to be the total taxable value of land and additions on the property. | Land | Improvement |
|---|---|---|---|---|
| 2025 | $1,877 | $61,200 | $5,970 | $55,230 |
| 2024 | $1,877 | $61,200 | $5,970 | $55,230 |
| 2023 | $1,901 | $61,200 | $5,970 | $55,230 |
| 2022 | $1,402 | $46,200 | $5,070 | $41,130 |
| 2021 | $1,429 | $46,200 | $5,070 | $41,130 |
| 2020 | $1,433 | $46,200 | $5,070 | $41,130 |
| 2019 | $1,136 | $37,970 | $5,070 | $32,900 |
| 2018 | $1,853 | $37,970 | $5,070 | $32,900 |
| 2017 | $1,980 | $54,150 | $8,590 | $45,560 |
| 2016 | $1,952 | $57,490 | $8,670 | $48,820 |
| 2015 | $1,952 | $57,490 | $8,670 | $48,820 |
| 2014 | $1,955 | $57,490 | $8,670 | $48,820 |
| 2013 | $1,994 | $53,050 | $8,670 | $44,380 |
Source: Public Records
Map
Nearby Homes
Your Personal Tour Guide
Ask me questions while you tour the home.