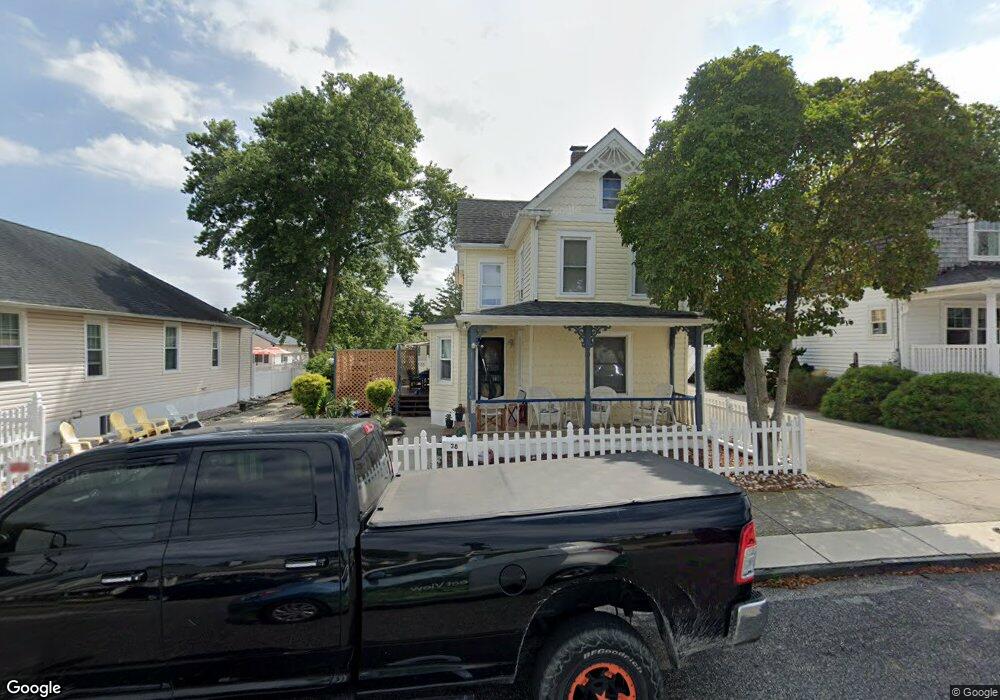
38 E New Jersey Ave Somers Point, NJ 08244
Estimated Value: $458,335 - $547,000
--
Bed
--
Bath
1,280
Sq Ft
$400/Sq Ft
Est. Value
About This Home
This home is located at 38 E New Jersey Ave, Somers Point, NJ 08244 and is currently estimated at $511,584, approximately $399 per square foot. 38 E New Jersey Ave is a home located in Atlantic County with nearby schools including Mainland Regional High School, ChARTer TECH High School for the Performing Arts, and Saint Joseph Regional School.
Ownership History
Date
Name
Owned For
Owner Type
Purchase Details
Closed on
Nov 18, 2011
Sold by
Wilkins Cheryl A and Wilkins Charles E
Bought by
Wilkins Cheryl A
Current Estimated Value
Purchase Details
Closed on
Feb 25, 2009
Sold by
38 East New Jersey Avenue Llc
Bought by
Wilkins Cheryl A and Wilkins Charles E
Purchase Details
Closed on
Sep 20, 2005
Sold by
Wilkins Cheryl
Bought by
38 E New Jersey Avenue Llc
Purchase Details
Closed on
Oct 3, 2002
Sold by
Wilkins Charles E
Bought by
Wilkins Cheryl A
Purchase Details
Closed on
May 20, 1999
Sold by
Liess David E and Liess Elizabeth J
Bought by
Wilkins Charles E
Home Financials for this Owner
Home Financials are based on the most recent Mortgage that was taken out on this home.
Original Mortgage
$90,000
Interest Rate
6.9%
Purchase Details
Closed on
Jul 6, 1990
Sold by
Plunkett Jr John J and Plunkett Kathleen Z
Bought by
Liess David E and Liess Elizabeth J
Create a Home Valuation Report for This Property
The Home Valuation Report is an in-depth analysis detailing your home's value as well as a comparison with similar homes in the area
Home Values in the Area
Average Home Value in this Area
Purchase History
| Date | Buyer | Sale Price | Title Company |
|---|---|---|---|
| Wilkins Cheryl A | -- | None Available | |
| Wilkins Cheryl A | -- | None Available | |
| 38 E New Jersey Avenue Llc | -- | -- | |
| Wilkins Cheryl A | -- | -- | |
| Wilkins Charles E | $118,000 | Citizens Title Ins Agency In | |
| Liess David E | $118,000 | -- |
Source: Public Records
Mortgage History
| Date | Status | Borrower | Loan Amount |
|---|---|---|---|
| Previous Owner | Wilkins Charles E | $90,000 |
Source: Public Records
Tax History Compared to Growth
Tax History
| Year | Tax Paid | Tax Assessment Tax Assessment Total Assessment is a certain percentage of the fair market value that is determined by local assessors to be the total taxable value of land and additions on the property. | Land | Improvement |
|---|---|---|---|---|
| 2025 | $6,186 | $173,000 | $79,500 | $93,500 |
| 2024 | $6,186 | $173,000 | $79,500 | $93,500 |
| 2023 | $5,780 | $173,000 | $79,500 | $93,500 |
| 2022 | $5,780 | $173,000 | $79,500 | $93,500 |
| 2021 | $5,693 | $173,000 | $79,500 | $93,500 |
| 2020 | $5,578 | $173,000 | $79,500 | $93,500 |
| 2019 | $5,420 | $173,000 | $79,500 | $93,500 |
| 2018 | $5,306 | $173,000 | $79,500 | $93,500 |
| 2017 | $5,116 | $173,000 | $79,500 | $93,500 |
| 2016 | $4,884 | $173,000 | $79,500 | $93,500 |
| 2015 | $4,834 | $173,000 | $79,500 | $93,500 |
| 2014 | $4,671 | $173,000 | $79,500 | $93,500 |
Source: Public Records
Map
Nearby Homes
- 820-822 Shore Rd
- 825 Bay Ave
- 827 Bay Ave
- 28 E New York Ave
- 27 Somers Ave
- 42 E New York Ave
- 127 Higbee Ave
- 804 2nd St
- 123 Pennsylvania Ave
- 742 3rd St
- 740 3rd St
- 746 4th St
- 215 Fox Terrace
- 308 Harbour Cove Unit 308
- 415 W New Jersey Ave
- 4 Par Dr
- 653 4th St
- 322 W Connecticut Ave Unit A
- 5 Greate Bay Dr Unit 5
- 508 W New Jersey Ave Unit 508 W New Jersey
- 34 E New Jersey Ave
- 42 E New Jersey Ave
- 38 Anchorage Ln
- 33 Anchorage Ln
- 30 E New Jersey Ave
- 46 E New Jersey Ave
- 37 E New Jersey Ave
- 43 E New Jersey Ave
- 50 E New Jersey Ave
- 33 E New Jersey Ave
- 30 Anchorage Ln
- 45 E New Jersey Ave
- 45 Anchorage Ln
- 31 E New Jersey Ave
- 49 E New Jersey Ave
- 54 E New Jersey Ave
- 26 Anchorage Ln
- 25 E New Jersey Ave
- 29 Delaware Ave
- 20 Anchorage Ln