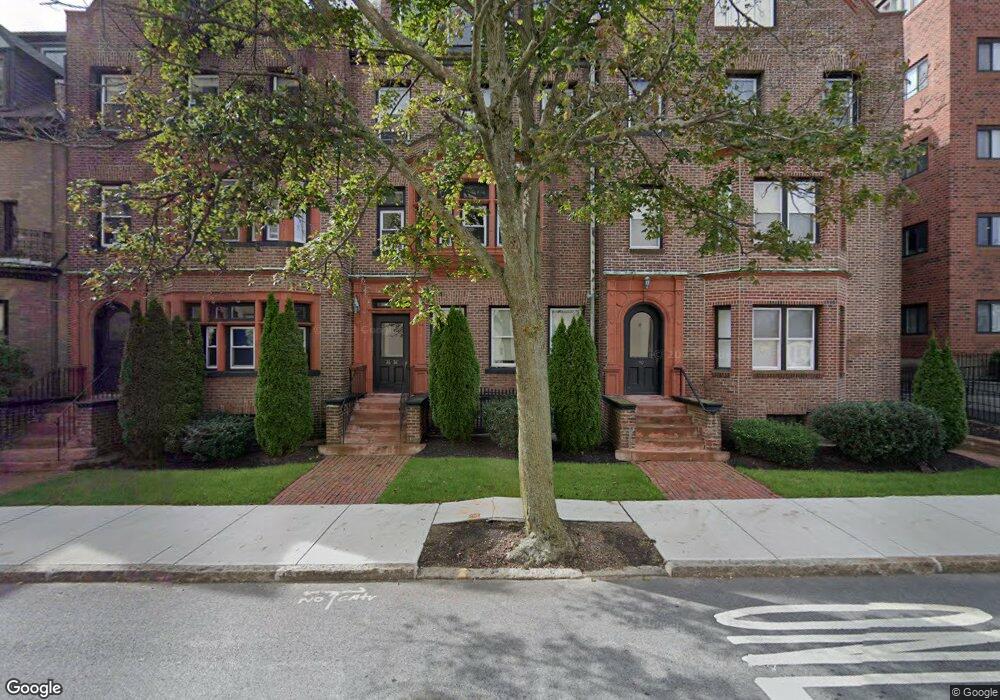
38 Elm St Unit 4 Worcester, MA 01609
Elm Park NeighborhoodEstimated Value: $254,574 - $317,000
1
Bed
1
Bath
1,026
Sq Ft
$270/Sq Ft
Est. Value
About This Home
This home is located at 38 Elm St Unit 4, Worcester, MA 01609 and is currently estimated at $277,394, approximately $270 per square foot. 38 Elm St Unit 4 is a home located in Worcester County with nearby schools including Jacob Hiatt Magnet School, Chandler Magnet, and Elm Park Elementary School.
Ownership History
Date
Name
Owned For
Owner Type
Purchase Details
Closed on
Jan 23, 2020
Sold by
50 Franklin Street Lp
Bought by
Manzi Stephen A
Current Estimated Value
Purchase Details
Closed on
Dec 28, 2017
Sold by
Bell Kierstan
Bought by
50 Franklin Street Lp
Purchase Details
Closed on
May 25, 2007
Sold by
Carroll Michael
Bought by
Bell Kierstan
Home Financials for this Owner
Home Financials are based on the most recent Mortgage that was taken out on this home.
Original Mortgage
$162,000
Interest Rate
6.27%
Mortgage Type
Purchase Money Mortgage
Purchase Details
Closed on
Feb 12, 2004
Sold by
Elm Linden Dev T and Ingram Herbert G
Bought by
Carroll Michael
Home Financials for this Owner
Home Financials are based on the most recent Mortgage that was taken out on this home.
Original Mortgage
$133,600
Interest Rate
5.82%
Mortgage Type
Purchase Money Mortgage
Create a Home Valuation Report for This Property
The Home Valuation Report is an in-depth analysis detailing your home's value as well as a comparison with similar homes in the area
Home Values in the Area
Average Home Value in this Area
Purchase History
| Date | Buyer | Sale Price | Title Company |
|---|---|---|---|
| Manzi Stephen A | -- | None Available | |
| 50 Franklin Street Lp | $181,200 | -- | |
| Bell Kierstan | $180,000 | -- | |
| Carroll Michael | $167,000 | -- |
Source: Public Records
Mortgage History
| Date | Status | Borrower | Loan Amount |
|---|---|---|---|
| Previous Owner | Bell Kierstan | $162,000 | |
| Previous Owner | Carroll Michael | $133,600 |
Source: Public Records
Tax History
| Year | Tax Paid | Tax Assessment Tax Assessment Total Assessment is a certain percentage of the fair market value that is determined by local assessors to be the total taxable value of land and additions on the property. | Land | Improvement |
|---|---|---|---|---|
| 2025 | $3,222 | $244,300 | $0 | $244,300 |
| 2024 | $3,079 | $223,900 | $0 | $223,900 |
| 2023 | $3,080 | $214,800 | $0 | $214,800 |
| 2022 | $2,724 | $179,100 | $0 | $179,100 |
| 2021 | $2,888 | $177,400 | $0 | $177,400 |
| 2020 | $2,610 | $153,500 | $0 | $153,500 |
| 2019 | $2,680 | $148,900 | $0 | $148,900 |
| 2018 | $3,387 | $179,100 | $0 | $179,100 |
| 2017 | $2,923 | $152,100 | $0 | $152,100 |
| 2016 | $2,850 | $138,300 | $0 | $138,300 |
| 2015 | $2,776 | $138,300 | $0 | $138,300 |
| 2014 | $2,910 | $148,900 | $0 | $148,900 |
Source: Public Records
Map
Nearby Homes
- 34 Elm St
- 22 Elm St Unit 402
- 22 Elm St Unit 110
- 22 Elm St Unit 412
- 14 Ashland St Unit 2R
- 56 Elm St Unit 2
- 29 William St Unit 22
- 6 Chatham Place Unit 6
- 13 West St
- 38 1/2 Bowdoin St
- 17 Federal St Unit 210
- 531 Main St Unit 403
- 21 Fruit St
- 70 Southbridge St Unit 611
- 70 Southbridge St Unit 310
- 70 Southbridge St Unit 703
- 3 Marston Way
- 15 Goulding St
- 13 Hampden St
- 60 Fruit St
- 38 Elm St Unit 3
- 38 Elm St Unit 2
- 38 Elm St Unit 1
- 38 Elm St Unit 38-2
- 40 Elm St Unit B
- 40 Elm St Unit 4
- 40 Elm St Unit 3
- 40 Elm St Unit 2
- 40 Elm St Unit 1
- 36 Elm St Unit B
- 36 Elm St Unit 4
- 36 Elm St Unit 3
- 36 Elm St Unit 2
- 36 Elm St Unit 1
- 40 Elm St Unit 40B
- 36 Elm St Unit 2-36
- 32 Elm St
- 44 Elm St Unit 518
- 44 Elm St Unit 516
- 44 Elm St Unit 515
Your Personal Tour Guide
Ask me questions while you tour the home.