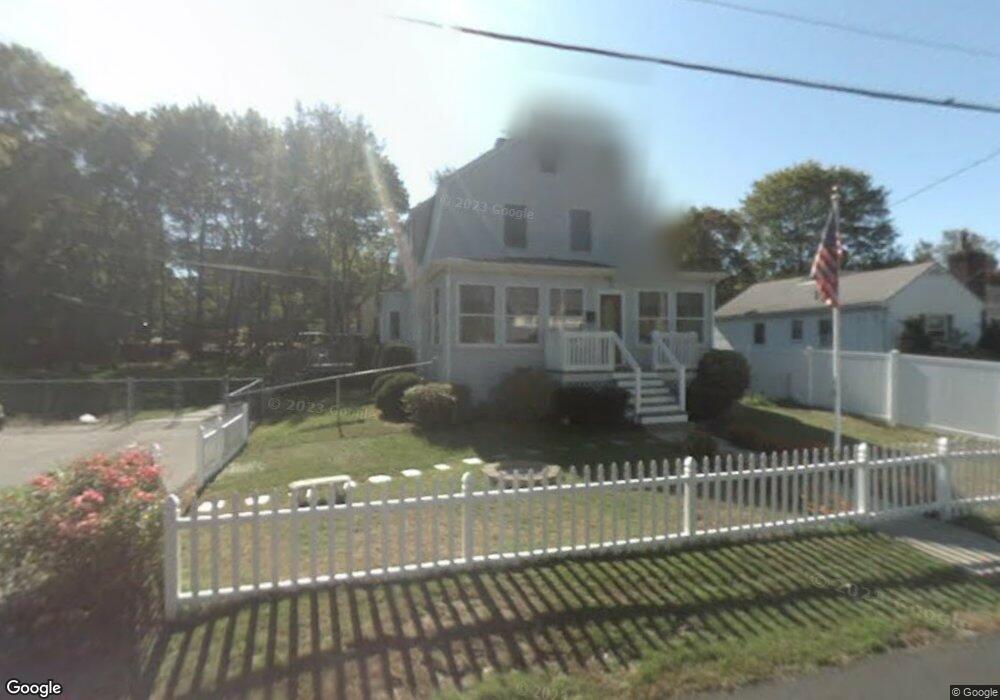
38 Everett St Abington, MA 02351
Estimated Value: $608,806 - $716,000
3
Beds
3
Baths
1,962
Sq Ft
$327/Sq Ft
Est. Value
About This Home
This home is located at 38 Everett St, Abington, MA 02351 and is currently estimated at $641,702, approximately $327 per square foot. 38 Everett St is a home located in Plymouth County with nearby schools including Beaver Brook Elementary School, Abington Middle School, and Woodsdale School.
Ownership History
Date
Name
Owned For
Owner Type
Purchase Details
Closed on
Jan 24, 2013
Sold by
Dever William E
Bought by
William E Dever T
Current Estimated Value
Purchase Details
Closed on
Jan 5, 2012
Sold by
Dever William E and Dever Deborah W
Bought by
Dever William E
Home Financials for this Owner
Home Financials are based on the most recent Mortgage that was taken out on this home.
Original Mortgage
$185,500
Interest Rate
4%
Mortgage Type
Adjustable Rate Mortgage/ARM
Purchase Details
Closed on
Oct 4, 1994
Sold by
Flanagan Patricia M
Bought by
Anzivino James A and Palmer Jill C
Home Financials for this Owner
Home Financials are based on the most recent Mortgage that was taken out on this home.
Original Mortgage
$123,700
Interest Rate
8.5%
Mortgage Type
Purchase Money Mortgage
Create a Home Valuation Report for This Property
The Home Valuation Report is an in-depth analysis detailing your home's value as well as a comparison with similar homes in the area
Home Values in the Area
Average Home Value in this Area
Purchase History
| Date | Buyer | Sale Price | Title Company |
|---|---|---|---|
| William E Dever T | -- | -- | |
| Dever William E | -- | -- | |
| Anzivino James A | $137,500 | -- |
Source: Public Records
Mortgage History
| Date | Status | Borrower | Loan Amount |
|---|---|---|---|
| Previous Owner | Anzivino James A | $185,500 | |
| Previous Owner | Anzivino James A | $90,000 | |
| Previous Owner | Anzivino James A | $123,700 |
Source: Public Records
Tax History
| Year | Tax Paid | Tax Assessment Tax Assessment Total Assessment is a certain percentage of the fair market value that is determined by local assessors to be the total taxable value of land and additions on the property. | Land | Improvement |
|---|---|---|---|---|
| 2025 | $7,190 | $550,500 | $264,400 | $286,100 |
| 2024 | $6,938 | $518,500 | $240,500 | $278,000 |
| 2023 | $6,623 | $466,100 | $218,800 | $247,300 |
| 2022 | $6,420 | $421,800 | $182,500 | $239,300 |
| 2021 | $6,185 | $360,400 | $166,400 | $194,000 |
| 2020 | $5,975 | $356,700 | $167,600 | $189,100 |
| 2019 | $5,885 | $338,400 | $160,700 | $177,700 |
| 2018 | $5,681 | $318,800 | $160,700 | $158,100 |
| 2017 | $5,666 | $308,800 | $160,700 | $148,100 |
| 2016 | $5,164 | $288,000 | $146,500 | $141,500 |
| 2015 | $4,932 | $290,100 | $146,500 | $143,600 |
Source: Public Records
Map
Nearby Homes
- 10 Bank St
- 9 Bank St
- 45 Bedford St
- 73 Block St
- 40 Bedford St
- 87 Summer St
- 34 Park Ave
- 7 Carlys Way
- 99 Washington St
- 35 Adams St
- 1142 Washington St
- 340 Centre Ave Unit 44
- 73 Monroe St
- 0 Bedford St
- 1190 Bedford St Unit G3
- 1353 Washington St
- 332 Hancock St
- 48 Sullivan Terrace
- 42 Van Buren Dr
- 360 High St
Your Personal Tour Guide
Ask me questions while you tour the home.