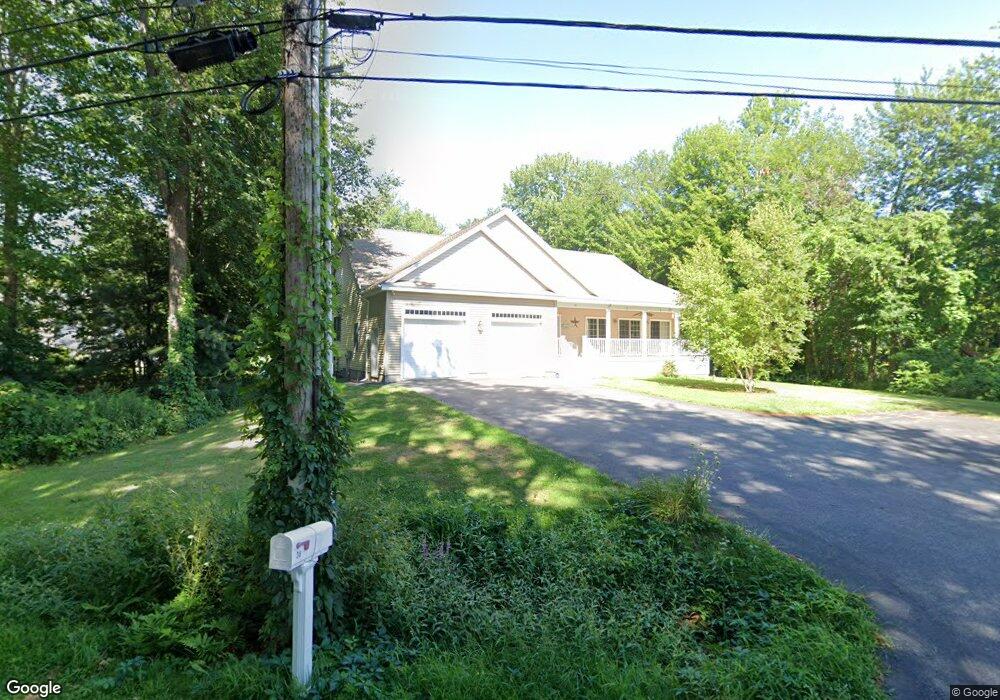
38 Ferry Ln Saco, ME 04072
Ferry Beach NeighborhoodEstimated Value: $808,000 - $871,000
3
Beds
2
Baths
2,116
Sq Ft
$399/Sq Ft
Est. Value
About This Home
This home is located at 38 Ferry Ln, Saco, ME 04072 and is currently estimated at $843,271, approximately $398 per square foot. 38 Ferry Ln is a home located in York County with nearby schools including C K Burns School, Saco Middle School, and Florence Lombard Christian School.
Ownership History
Date
Name
Owned For
Owner Type
Purchase Details
Closed on
Jun 5, 2023
Sold by
Chamberlain Donald F
Bought by
Chamberlain Ft and Chamberlain
Current Estimated Value
Purchase Details
Closed on
May 31, 2023
Sold by
Chamberlain Donald F and Chamberlain Pauline J
Bought by
Chamberlain Donald F
Purchase Details
Closed on
May 4, 2005
Sold by
Gregoire Patricia A and Gregoire Allen P
Bought by
Chamberlain Pauline J and Chamberlain Donald F
Create a Home Valuation Report for This Property
The Home Valuation Report is an in-depth analysis detailing your home's value as well as a comparison with similar homes in the area
Home Values in the Area
Average Home Value in this Area
Purchase History
We collect this data history from publicly available records. To have your information removed, we recommend requesting removal directly through your county’s website.
| Date | Buyer | Sale Price | Title Company |
|---|---|---|---|
| Chamberlain Ft | -- | None Available | |
| Chamberlain Donald F | -- | None Available | |
| Chamberlain Pauline J | -- | -- |
Source: Public Records
Tax History
| Year | Tax Paid | Tax Assessment Tax Assessment Total Assessment is a certain percentage of the fair market value that is determined by local assessors to be the total taxable value of land and additions on the property. | Land | Improvement |
|---|---|---|---|---|
| 2024 | $8,396 | $597,600 | $165,200 | $432,400 |
| 2023 | $8,815 | $597,600 | $165,200 | $432,400 |
| 2022 | $7,838 | $427,600 | $125,600 | $302,000 |
| 2021 | $7,603 | $402,700 | $113,800 | $288,900 |
| 2020 | $7,242 | $368,200 | $102,100 | $266,100 |
| 2019 | $7,136 | $368,200 | $102,100 | $266,100 |
| 2018 | $7,058 | $364,200 | $98,100 | $266,100 |
| 2017 | $6,822 | $352,000 | $89,200 | $262,800 |
| 2016 | $6,558 | $337,700 | $85,700 | $252,000 |
| 2015 | $6,429 | $334,500 | $85,700 | $248,800 |
| 2014 | $6,228 | $334,500 | $85,700 | $248,800 |
| 2013 | $6,215 | $334,500 | $85,700 | $248,800 |
Source: Public Records
Map
Nearby Homes
- 2 Courtlynn Cir
- 3 Island View Ave
- 18 Camp Ellis Ave
- 527 Pool St
- 10 Lower Beach Rd
- 453 Pool St
- 650 Pool St
- 625 Pool St
- 3 Walker Dr Unit 101
- 4 Walker Dr Unit 101
- 3 Walker Dr Unit 101
- 26 Meeting House Rd
- 311 Seaside Ave Unit 3
- TBD 530 Ferry Rd
- 3 Driftwood Ln
- 35 Plymouth Dr
- 378 Pool St
- 353 Pool St
- 66 Old Pool Rd
- 9 Windward Ridge
Your Personal Tour Guide
Ask me questions while you tour the home.