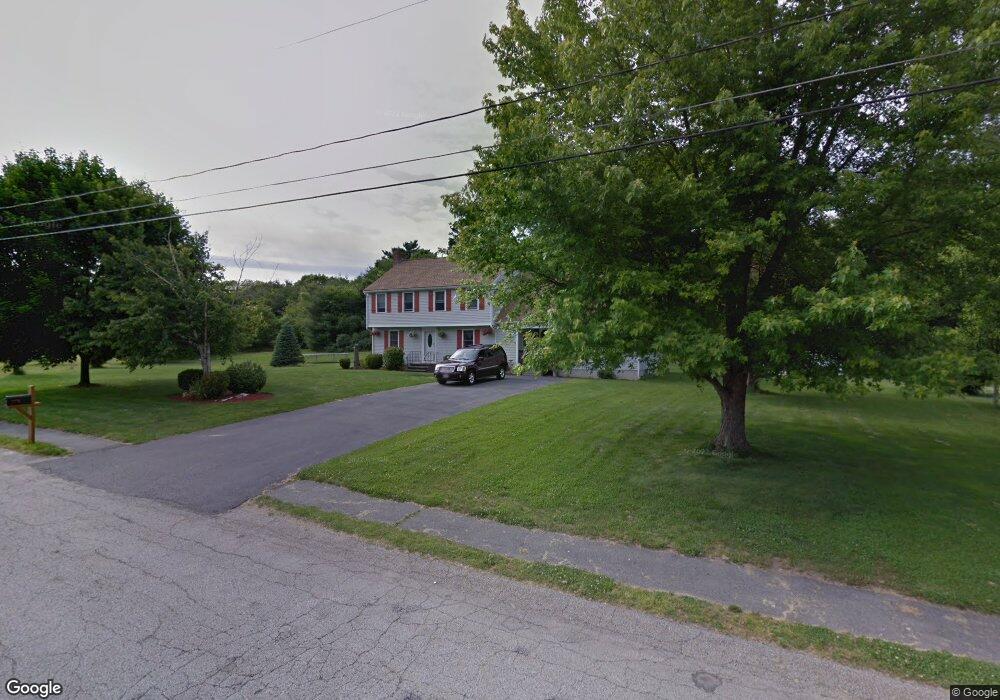
38 Fieldcrest Dr East Bridgewater, MA 02333
Estimated Value: $751,000 - $830,000
4
Beds
3
Baths
2,845
Sq Ft
$278/Sq Ft
Est. Value
About This Home
This home is located at 38 Fieldcrest Dr, East Bridgewater, MA 02333 and is currently estimated at $790,123, approximately $277 per square foot. 38 Fieldcrest Dr is a home located in Plymouth County with nearby schools including Central Elementary School, Gordon W Mitchell Middle School, and East Bridgewater Jr./Sr. High School.
Ownership History
Date
Name
Owned For
Owner Type
Purchase Details
Closed on
Apr 29, 2025
Sold by
Voss Timothy and Voss Carol
Bought by
Carol & Timothy Voss Ret and Voss
Current Estimated Value
Purchase Details
Closed on
Sep 30, 2002
Sold by
Obrien Kevin and Obrien Richardine
Bought by
Voss Timothy and Voss Carol
Purchase Details
Closed on
Aug 18, 2000
Sold by
Portland Dev Corp and Kasper James J
Bought by
Kasper James J and Kasper Leona C
Purchase Details
Closed on
Jul 28, 2000
Sold by
Kasper James and Kasper Leona
Bought by
Obrien Kevin G and Obrien Richardine F
Purchase Details
Closed on
Jun 23, 1989
Sold by
Foxglove Rt
Bought by
Kasper James
Create a Home Valuation Report for This Property
The Home Valuation Report is an in-depth analysis detailing your home's value as well as a comparison with similar homes in the area
Home Values in the Area
Average Home Value in this Area
Purchase History
| Date | Buyer | Sale Price | Title Company |
|---|---|---|---|
| Carol & Timothy Voss Ret | -- | None Available | |
| Carol & Timothy Voss Ret | -- | None Available | |
| Voss Timothy | $329,900 | -- | |
| Voss Timothy | $329,900 | -- | |
| Kasper James J | $155,230 | -- | |
| Kasper James J | $155,230 | -- | |
| Obrien Kevin G | $247,000 | -- | |
| Obrien Kevin G | $247,000 | -- | |
| Kasper James | $184,900 | -- | |
| Kasper James | $184,900 | -- |
Source: Public Records
Mortgage History
| Date | Status | Borrower | Loan Amount |
|---|---|---|---|
| Previous Owner | Kasper James | $216,000 | |
| Previous Owner | Kasper James | $15,000 |
Source: Public Records
Tax History Compared to Growth
Tax History
| Year | Tax Paid | Tax Assessment Tax Assessment Total Assessment is a certain percentage of the fair market value that is determined by local assessors to be the total taxable value of land and additions on the property. | Land | Improvement |
|---|---|---|---|---|
| 2025 | $8,713 | $637,400 | $235,300 | $402,100 |
| 2024 | $8,557 | $618,300 | $226,200 | $392,100 |
| 2023 | $8,372 | $579,400 | $226,200 | $353,200 |
| 2022 | $7,922 | $507,800 | $197,200 | $310,600 |
| 2021 | $6,859 | $460,700 | $189,500 | $271,200 |
| 2020 | $92 | $443,200 | $182,400 | $260,800 |
| 2019 | $7,428 | $423,000 | $174,300 | $248,700 |
| 2018 | $7,355 | $409,500 | $174,300 | $235,200 |
| 2017 | $7,144 | $390,400 | $166,300 | $224,100 |
| 2016 | $6,883 | $379,000 | $166,300 | $212,700 |
| 2015 | $6,559 | $369,300 | $158,000 | $211,300 |
| 2014 | $6,290 | $362,100 | $154,700 | $207,400 |
Source: Public Records
Map
Nearby Homes
- 587 Bridge St
- 51 Stonegate Dr
- 28 Brookbend Way E
- 26 Meadowbrook Dr
- 182 Crystal Water Dr Unit 182
- 71 Stonegate Dr
- 217 Crystal Water Dr
- 1993 Washington St
- 78 Crystal Water Dr
- 2045 Washington St
- 94 Pond St
- 1 Simmons Place
- 29 Hayes Rd
- 936 Central St
- 1247 Central St
- 455 Plymouth St
- 121 South St
- 261 Plymouth St
- 23 Stone Meadow Dr
- 71 Church St
- 40 Fieldcrest Dr
- 36 Fieldcrest Dr
- 39 Fieldcrest Dr
- 42 Fieldcrest Dr
- 33 Fieldcrest Dr
- 34 Fieldcrest Dr
- 43 Fieldcrest Dr
- 50 Fieldcrest Dr
- 32 Fieldcrest Dr
- 31 Fieldcrest Dr
- 55 Fieldcrest Dr
- 3 Fieldcrest Dr
- 259 Crescent St
- 9 Fieldcrest Dr
- 249 Crescent St
- 30 Fieldcrest Dr
- 241 Crescent St
- 27 Fieldcrest Dr
- 271 Crescent St
- 283 Crescent St