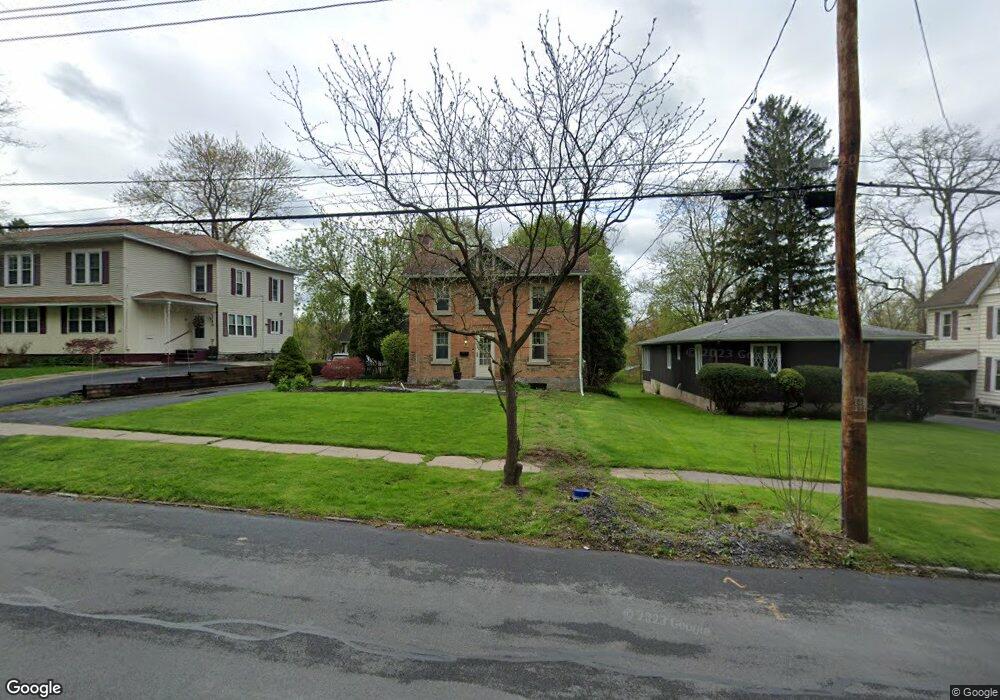
38 Fitch Ave Auburn, NY 13021
Estimated Value: $202,000 - $230,000
3
Beds
2
Baths
1,650
Sq Ft
$132/Sq Ft
Est. Value
About This Home
This home is located at 38 Fitch Ave, Auburn, NY 13021 and is currently estimated at $217,941, approximately $132 per square foot. 38 Fitch Ave is a home located in Cayuga County with nearby schools including Auburn Junior High School, Auburn High School, and Creative Minds Montessori School.
Ownership History
Date
Name
Owned For
Owner Type
Purchase Details
Closed on
Dec 4, 2009
Sold by
Mason Christine
Bought by
Parker Michael
Current Estimated Value
Home Financials for this Owner
Home Financials are based on the most recent Mortgage that was taken out on this home.
Original Mortgage
$119,790
Outstanding Balance
$78,574
Interest Rate
5.01%
Mortgage Type
FHA
Estimated Equity
$139,367
Purchase Details
Closed on
Jul 15, 2005
Sold by
Sherman Barbara
Bought by
Mason Christine
Home Financials for this Owner
Home Financials are based on the most recent Mortgage that was taken out on this home.
Original Mortgage
$72,800
Interest Rate
5.67%
Mortgage Type
New Conventional
Purchase Details
Closed on
Nov 23, 1994
Sold by
Young Ernest and Young Donna
Bought by
Hill Barbara
Create a Home Valuation Report for This Property
The Home Valuation Report is an in-depth analysis detailing your home's value as well as a comparison with similar homes in the area
Home Values in the Area
Average Home Value in this Area
Purchase History
| Date | Buyer | Sale Price | Title Company |
|---|---|---|---|
| Parker Michael | $122,000 | John Karpinski | |
| Parker Michael | $122,000 | None Available | |
| Mason Christine | $91,000 | John Rossi | |
| Hill Barbara | $59,900 | -- |
Source: Public Records
Mortgage History
| Date | Status | Borrower | Loan Amount |
|---|---|---|---|
| Open | Parker Michael | $119,790 | |
| Previous Owner | Mason Christine | $72,800 |
Source: Public Records
Tax History Compared to Growth
Tax History
| Year | Tax Paid | Tax Assessment Tax Assessment Total Assessment is a certain percentage of the fair market value that is determined by local assessors to be the total taxable value of land and additions on the property. | Land | Improvement |
|---|---|---|---|---|
| 2024 | $3,348 | $143,600 | $22,600 | $121,000 |
| 2023 | $3,344 | $143,600 | $22,600 | $121,000 |
| 2022 | $2,845 | $143,600 | $22,600 | $121,000 |
| 2021 | $2,593 | $114,900 | $12,400 | $102,500 |
| 2020 | $2,554 | $114,900 | $12,400 | $102,500 |
| 2019 | $977 | $114,900 | $12,400 | $102,500 |
| 2018 | $2,480 | $114,900 | $12,400 | $102,500 |
| 2017 | $2,513 | $112,100 | $13,000 | $99,100 |
| 2016 | $3,349 | $112,100 | $13,000 | $99,100 |
| 2015 | $1,543 | $112,100 | $13,000 | $99,100 |
| 2014 | $1,543 | $112,100 | $13,000 | $99,100 |
Source: Public Records
Map
Nearby Homes