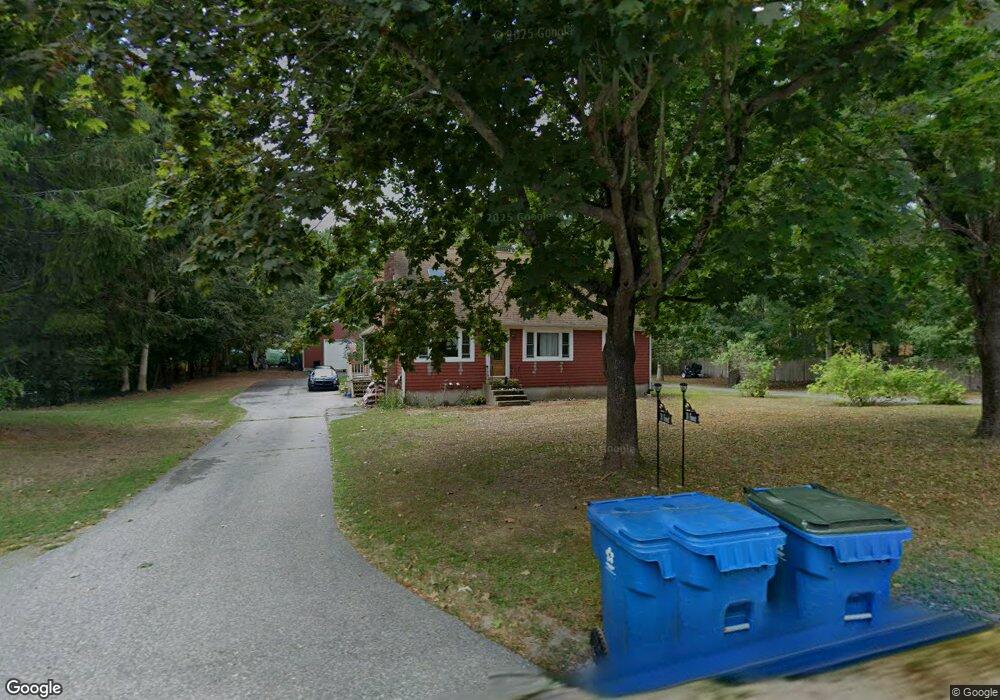
38 Forest St Carver, MA 02330
Estimated Value: $653,205 - $712,000
3
Beds
2
Baths
1,680
Sq Ft
$401/Sq Ft
Est. Value
About This Home
This home is located at 38 Forest St, Carver, MA 02330 and is currently estimated at $673,551, approximately $400 per square foot. 38 Forest St is a home located in Plymouth County with nearby schools including Carver Elementary School, Carver Middle/High School, and Samuel Fuller School.
Ownership History
Date
Name
Owned For
Owner Type
Purchase Details
Closed on
Dec 3, 2010
Sold by
Gregory Scott S and Gregory Sarah A
Bought by
Wiggin Jared A and Wiggin Erin
Current Estimated Value
Home Financials for this Owner
Home Financials are based on the most recent Mortgage that was taken out on this home.
Original Mortgage
$295,000
Interest Rate
4.22%
Mortgage Type
Purchase Money Mortgage
Purchase Details
Closed on
May 24, 1988
Sold by
Nassetta Scott W
Bought by
Gregory Soctt S
Create a Home Valuation Report for This Property
The Home Valuation Report is an in-depth analysis detailing your home's value as well as a comparison with similar homes in the area
Home Values in the Area
Average Home Value in this Area
Purchase History
| Date | Buyer | Sale Price | Title Company |
|---|---|---|---|
| Wiggin Jared A | $295,000 | -- | |
| Gregory Soctt S | $129,000 | -- |
Source: Public Records
Mortgage History
| Date | Status | Borrower | Loan Amount |
|---|---|---|---|
| Open | Gregory Soctt S | $289,440 | |
| Closed | Wiggin Jared A | $295,000 | |
| Previous Owner | Gregory Soctt S | $234,400 | |
| Previous Owner | Gregory Soctt S | $75,000 |
Source: Public Records
Tax History
| Year | Tax Paid | Tax Assessment Tax Assessment Total Assessment is a certain percentage of the fair market value that is determined by local assessors to be the total taxable value of land and additions on the property. | Land | Improvement |
|---|---|---|---|---|
| 2025 | $8,482 | $611,500 | $166,200 | $445,300 |
| 2024 | $8,109 | $572,300 | $162,900 | $409,400 |
| 2023 | $7,830 | $536,700 | $162,900 | $373,800 |
| 2022 | $7,488 | $468,600 | $139,300 | $329,300 |
| 2021 | $7,205 | $425,300 | $124,400 | $300,900 |
| 2020 | $6,953 | $404,500 | $116,300 | $288,200 |
| 2019 | $6,721 | $394,200 | $112,900 | $281,300 |
| 2018 | $6,327 | $358,900 | $112,900 | $246,000 |
| 2017 | $6,075 | $343,400 | $108,600 | $234,800 |
| 2016 | $5,606 | $329,200 | $103,400 | $225,800 |
| 2015 | $5,469 | $321,500 | $103,400 | $218,100 |
| 2014 | $5,448 | $320,300 | $130,700 | $189,600 |
Source: Public Records
Map
Nearby Homes
Your Personal Tour Guide
Ask me questions while you tour the home.