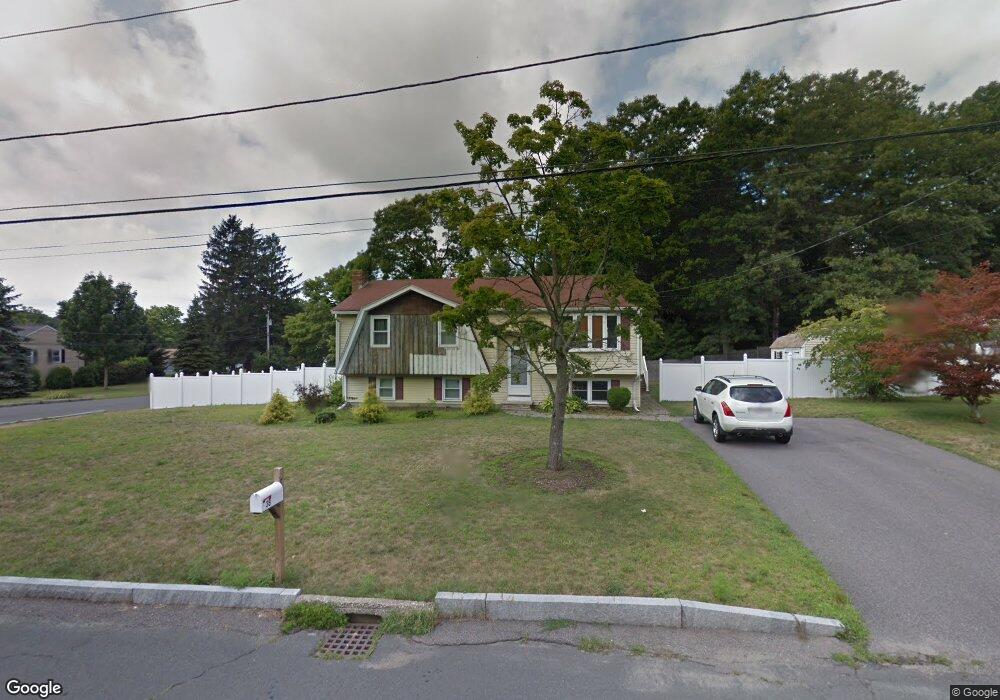
38 Fox Run Rd North Attleboro, MA 02760
North Attleboro NeighborhoodEstimated Value: $508,000 - $678,000
4
Beds
3
Baths
1,080
Sq Ft
$544/Sq Ft
Est. Value
About This Home
This home is located at 38 Fox Run Rd, North Attleboro, MA 02760 and is currently estimated at $587,006, approximately $543 per square foot. 38 Fox Run Rd is a home located in Bristol County with nearby schools including North Attleboro High School.
Ownership History
Date
Name
Owned For
Owner Type
Purchase Details
Closed on
Nov 1, 2000
Sold by
Cochrane Roy E and Cochrane Deidre L
Bought by
Quddumi Mohammed A
Current Estimated Value
Home Financials for this Owner
Home Financials are based on the most recent Mortgage that was taken out on this home.
Original Mortgage
$184,200
Interest Rate
7.83%
Mortgage Type
Purchase Money Mortgage
Create a Home Valuation Report for This Property
The Home Valuation Report is an in-depth analysis detailing your home's value as well as a comparison with similar homes in the area
Home Values in the Area
Average Home Value in this Area
Purchase History
| Date | Buyer | Sale Price | Title Company |
|---|---|---|---|
| Quddumi Mohammed A | $189,900 | -- |
Source: Public Records
Mortgage History
| Date | Status | Borrower | Loan Amount |
|---|---|---|---|
| Open | Quddumi Mohammed A | $184,200 | |
| Closed | Quddumi Mohammed A | $184,200 | |
| Previous Owner | Quddumi Mohammed A | $120,000 |
Source: Public Records
Tax History Compared to Growth
Tax History
| Year | Tax Paid | Tax Assessment Tax Assessment Total Assessment is a certain percentage of the fair market value that is determined by local assessors to be the total taxable value of land and additions on the property. | Land | Improvement |
|---|---|---|---|---|
| 2025 | $5,356 | $454,300 | $148,100 | $306,200 |
| 2024 | $5,121 | $443,800 | $148,100 | $295,700 |
| 2023 | $5,354 | $418,600 | $148,100 | $270,500 |
| 2022 | $5,175 | $371,500 | $148,100 | $223,400 |
| 2021 | $5,023 | $352,000 | $148,100 | $203,900 |
| 2020 | $4,893 | $341,000 | $148,100 | $192,900 |
| 2019 | $4,702 | $330,200 | $134,700 | $195,500 |
| 2018 | $4,191 | $314,200 | $134,700 | $179,500 |
| 2017 | $4,006 | $303,000 | $134,700 | $168,300 |
| 2016 | $3,897 | $294,800 | $149,500 | $145,300 |
| 2015 | $3,641 | $277,100 | $149,500 | $127,600 |
| 2014 | $3,420 | $258,300 | $131,300 | $127,000 |
Source: Public Records
Map
Nearby Homes
- 3 Serengeti Dr
- 217 Fisher St
- 212 Fisher St Unit A5
- 8 Al Pace Dr Unit 8
- 1066 Mount Hope St
- 64 Smith St
- 633 E Washington St Unit 17
- 633 E Washington St Unit 10
- 12 Houde St
- 0 Landry 2nd Unit 73350867
- 711 Mount Hope St Unit 7
- 711 Mount Hope St Unit 6
- 711 Mount Hope St Unit 8
- 711 Mount Hope St Unit 5
- 711 Mount Hope St Unit 12
- 711 Mount Hope St Unit 9
- 711 Mount Hope St Unit 11
- 711 Mount Hope St Unit 10
- 711 Mount Hope St Unit 16
- 711 Mount Hope St Unit 15
- 20 Fox Run Rd
- 48 Fox Run Rd
- 7 Kitt Rd
- 8 Kitt Rd
- 889 Mount Hope St
- 2 Lester Wall Dr
- 1 Lester Wall Dr
- 7 Brick Kiln Rd
- 58 Fox Run Rd
- 16 Kitt Rd
- 17 Kitt Rd
- 885 Mount Hope St
- 905 Mount Hope St
- 4 Lester Wall Dr
- 15 Brick Kiln Rd
- 915 Mount Hope St
- 879 Mount Hope St
- 4 Brick Kiln Rd
- 4 Brick Kiln Rd Unit 4
- 921 Mount Hope St