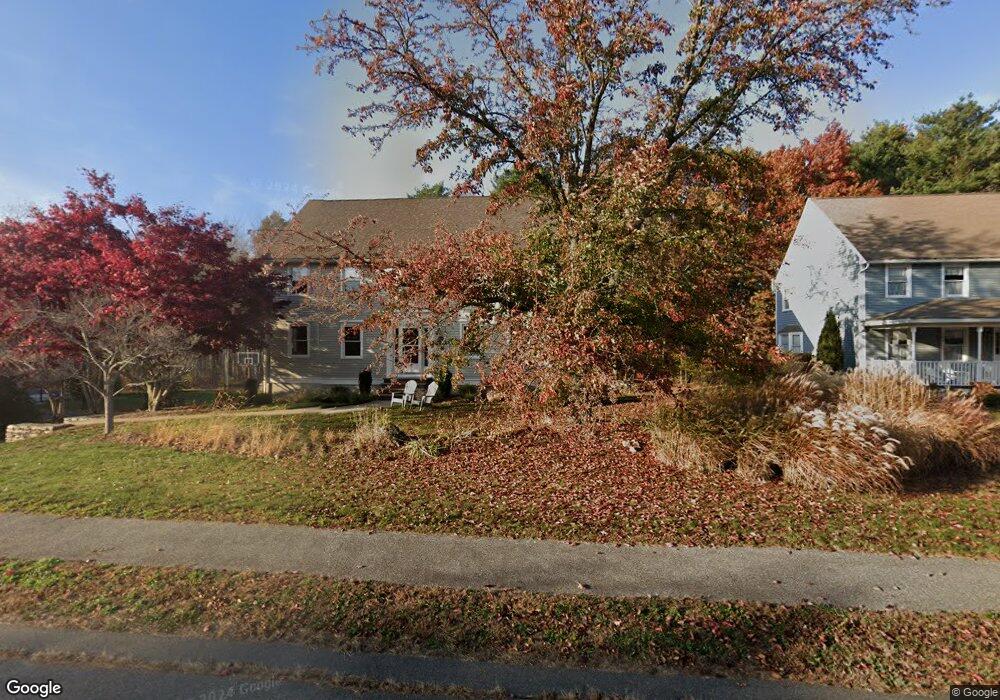
38 Frances Dr Newburyport, MA 01950
Estimated Value: $1,099,000 - $1,256,000
4
Beds
3
Baths
2,390
Sq Ft
$496/Sq Ft
Est. Value
About This Home
This home is located at 38 Frances Dr, Newburyport, MA 01950 and is currently estimated at $1,186,161, approximately $496 per square foot. 38 Frances Dr is a home located in Essex County with nearby schools including Francis T. Bresnahan Elementary School, Edward G. Molin Elementary School, and Rupert A. Nock Middle School.
Ownership History
Date
Name
Owned For
Owner Type
Purchase Details
Closed on
Feb 3, 2011
Sold by
Pilz Michael and Pilz Jennifer
Bought by
Brock Donald J and Brock Nancy B
Current Estimated Value
Purchase Details
Closed on
Feb 28, 2006
Sold by
Kreuz Barbara J and Kreuz Paul E
Bought by
Pilz Michael and Pilz Jennifer
Purchase Details
Closed on
Sep 13, 1995
Sold by
Wilbur Rt and Salter Wilbur
Bought by
Kreuz Paul E and Kreuz Barbara
Create a Home Valuation Report for This Property
The Home Valuation Report is an in-depth analysis detailing your home's value as well as a comparison with similar homes in the area
Home Values in the Area
Average Home Value in this Area
Purchase History
| Date | Buyer | Sale Price | Title Company |
|---|---|---|---|
| Brock Donald J | $521,000 | -- | |
| Pilz Michael | $575,000 | -- | |
| Kreuz Paul E | $240,000 | -- |
Source: Public Records
Mortgage History
| Date | Status | Borrower | Loan Amount |
|---|---|---|---|
| Open | Kreuz Paul E | $408,096 | |
| Closed | Kreuz Paul E | $412,600 |
Source: Public Records
Tax History Compared to Growth
Tax History
| Year | Tax Paid | Tax Assessment Tax Assessment Total Assessment is a certain percentage of the fair market value that is determined by local assessors to be the total taxable value of land and additions on the property. | Land | Improvement |
|---|---|---|---|---|
| 2025 | $10,091 | $1,053,300 | $462,500 | $590,800 |
| 2024 | $9,787 | $981,600 | $420,400 | $561,200 |
| 2023 | $8,920 | $830,500 | $365,600 | $464,900 |
| 2022 | $8,806 | $733,200 | $304,600 | $428,600 |
| 2021 | $8,628 | $682,600 | $277,000 | $405,600 |
| 2020 | $8,527 | $664,100 | $277,000 | $387,100 |
| 2019 | $8,686 | $664,100 | $277,000 | $387,100 |
| 2018 | $8,220 | $619,900 | $263,800 | $356,100 |
| 2017 | $8,363 | $621,800 | $251,300 | $370,500 |
| 2016 | $7,681 | $573,600 | $228,900 | $344,700 |
| 2015 | $7,652 | $573,600 | $228,900 | $344,700 |
Source: Public Records
Map
Nearby Homes