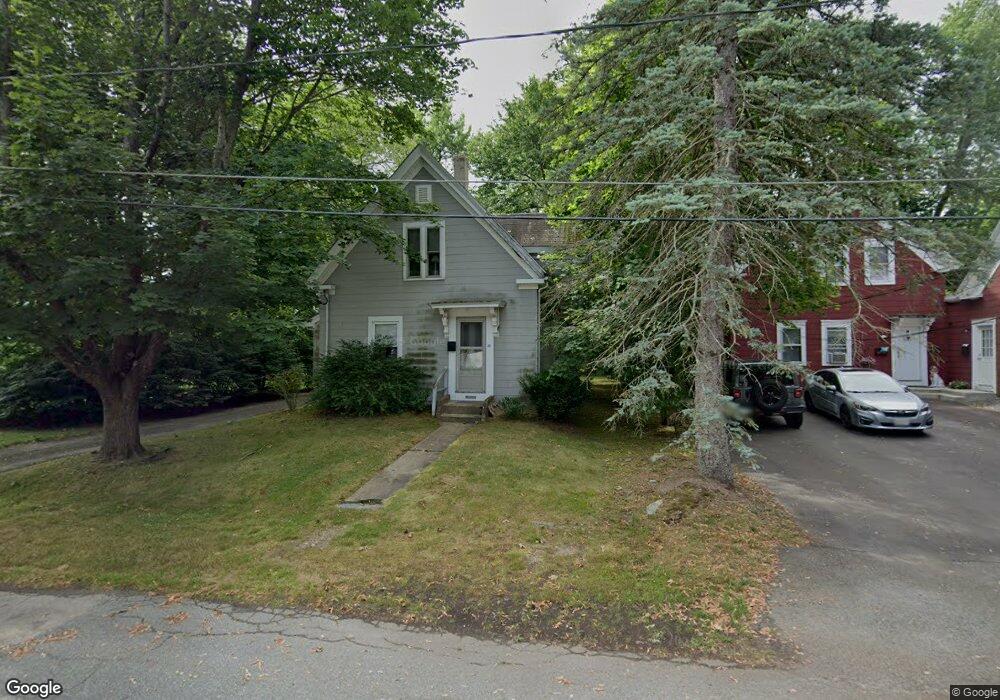
38 Gold St Whitman, MA 02382
Estimated Value: $511,179 - $658,000
5
Beds
2
Baths
1,708
Sq Ft
$344/Sq Ft
Est. Value
About This Home
This home is located at 38 Gold St, Whitman, MA 02382 and is currently estimated at $587,795, approximately $344 per square foot. 38 Gold St is a home located in Plymouth County with nearby schools including St Bridget School.
Ownership History
Date
Name
Owned For
Owner Type
Purchase Details
Closed on
Oct 23, 2020
Sold by
Mosher Eleanor F
Bought by
Mosher Karen F
Current Estimated Value
Purchase Details
Closed on
Jul 20, 2018
Sold by
Mosher Roy W
Bought by
Mosher Eleanor F
Purchase Details
Closed on
Jul 11, 2018
Sold by
Mosher Karen F
Bought by
Mosher Roy W and Mosher Eleanor F
Purchase Details
Closed on
Mar 15, 2018
Sold by
Mosher Roy W and Mosher Eleanor F
Bought by
Mosher Karen F
Purchase Details
Closed on
Feb 6, 1963
Bought by
Mosher Roy W and Mosher Eleanor F
Create a Home Valuation Report for This Property
The Home Valuation Report is an in-depth analysis detailing your home's value as well as a comparison with similar homes in the area
Home Values in the Area
Average Home Value in this Area
Purchase History
| Date | Buyer | Sale Price | Title Company |
|---|---|---|---|
| Mosher Karen F | -- | None Available | |
| Mosher Eleanor F | -- | -- | |
| Mosher Roy W | -- | -- | |
| Mosher Karen F | -- | -- | |
| Mosher Roy W | -- | -- |
Source: Public Records
Tax History
| Year | Tax Paid | Tax Assessment Tax Assessment Total Assessment is a certain percentage of the fair market value that is determined by local assessors to be the total taxable value of land and additions on the property. | Land | Improvement |
|---|---|---|---|---|
| 2025 | $5,741 | $437,600 | $201,200 | $236,400 |
| 2024 | $5,278 | $414,300 | $197,300 | $217,000 |
| 2023 | $5,150 | $379,500 | $171,000 | $208,500 |
| 2022 | $5,030 | $345,500 | $155,500 | $190,000 |
| 2021 | $4,969 | $320,600 | $142,900 | $177,700 |
| 2020 | $4,866 | $307,000 | $129,300 | $177,700 |
| 2019 | $4,173 | $271,300 | $129,300 | $142,000 |
| 2018 | $3,874 | $253,400 | $122,500 | $130,900 |
| 2017 | $3,692 | $244,800 | $122,500 | $122,300 |
| 2016 | $3,685 | $236,400 | $116,600 | $119,800 |
| 2015 | $3,595 | $230,300 | $116,600 | $113,700 |
Source: Public Records
Map
Nearby Homes
- 95 Temple St
- 118 Temple St
- 8 Laurel St
- 48 Day St
- 110 South Ave
- 56-58 Vernon St
- 42 Rock St
- 147 South Ave
- 150 Harvard St
- 159 Auburn St
- 157 Auburn St Unit 157
- 289 Commercial St
- 48 Sullivan Terrace
- 66 Belmont St
- 154 Auburn St
- 501 Auburn St Unit 508
- 61 Suffolk St
- 293 Bedford St
- 300 High St
- 22 Old Coach Rd
- 42 Gold St Unit 44
- 30 Gold St
- 24 Gold St
- 52 Gold St
- 39 Gold St
- 29 Gold St
- 11 Silver St
- 11 Silver St Unit 1
- 47 Gold St
- 000 Confidential
- 0 Willow St Unit 70699636
- 25 Gold St
- 25 Gold St Unit 2
- 25 Gold St Unit 1
- 58 Gold St
- 58 Gold St Unit house
- 57 Temple St Unit 59
- 55 Gold St
- 61 Temple St Unit 63
- 33 Silver St
Your Personal Tour Guide
Ask me questions while you tour the home.