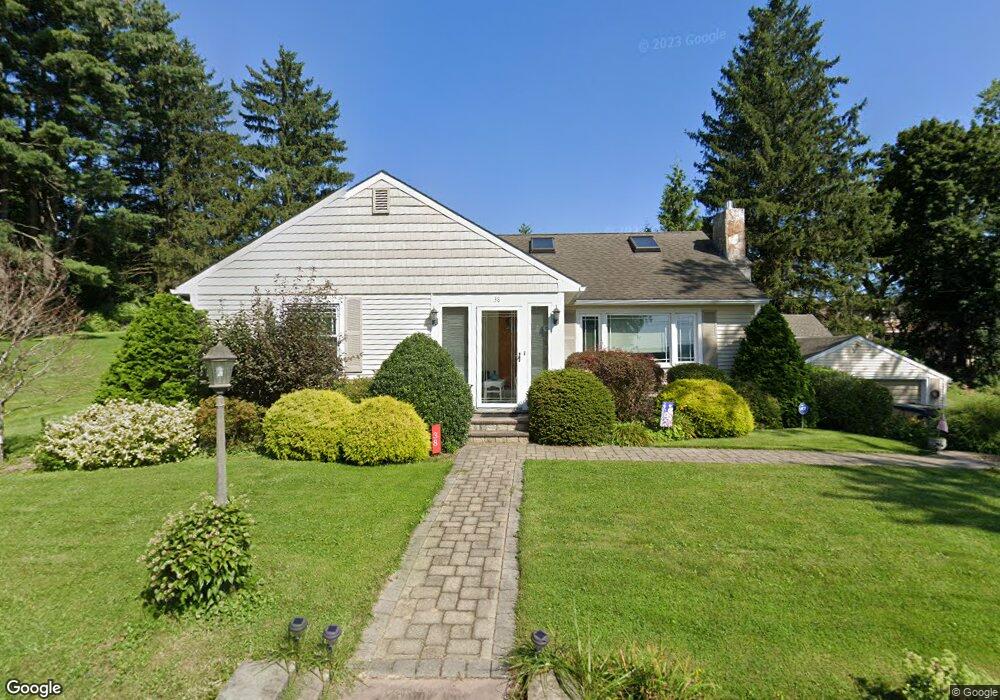
38 Grant St Spencer, MA 01562
Estimated Value: $392,934 - $428,000
3
Beds
1
Bath
1,724
Sq Ft
$238/Sq Ft
Est. Value
About This Home
This home is located at 38 Grant St, Spencer, MA 01562 and is currently estimated at $409,984, approximately $237 per square foot. 38 Grant St is a home located in Worcester County with nearby schools including David Prouty High School.
Ownership History
Date
Name
Owned For
Owner Type
Purchase Details
Closed on
Nov 17, 2006
Sold by
Redfield Addison
Bought by
Vigeant Rachel C and Sugalski Richard J
Current Estimated Value
Home Financials for this Owner
Home Financials are based on the most recent Mortgage that was taken out on this home.
Original Mortgage
$196,000
Interest Rate
6.33%
Mortgage Type
Purchase Money Mortgage
Purchase Details
Closed on
Aug 19, 2004
Sold by
Drew Mtg Assoc Inc and Bullock Claudia
Bought by
Redfield Addison
Purchase Details
Closed on
Apr 1, 2002
Sold by
Barre Evelyn A
Bought by
Bullock Robert P and Bullock Claudia R
Home Financials for this Owner
Home Financials are based on the most recent Mortgage that was taken out on this home.
Original Mortgage
$145,600
Interest Rate
6.88%
Mortgage Type
Purchase Money Mortgage
Create a Home Valuation Report for This Property
The Home Valuation Report is an in-depth analysis detailing your home's value as well as a comparison with similar homes in the area
Home Values in the Area
Average Home Value in this Area
Purchase History
| Date | Buyer | Sale Price | Title Company |
|---|---|---|---|
| Vigeant Rachel C | $245,000 | -- | |
| Redfield Addison | -- | -- | |
| Bullock Robert P | $182,000 | -- |
Source: Public Records
Mortgage History
| Date | Status | Borrower | Loan Amount |
|---|---|---|---|
| Open | Bullock Robert P | $192,900 | |
| Closed | Vigeant Rachel C | $196,000 | |
| Previous Owner | Bullock Robert P | $145,600 |
Source: Public Records
Tax History Compared to Growth
Tax History
| Year | Tax Paid | Tax Assessment Tax Assessment Total Assessment is a certain percentage of the fair market value that is determined by local assessors to be the total taxable value of land and additions on the property. | Land | Improvement |
|---|---|---|---|---|
| 2025 | $43 | $368,500 | $47,000 | $321,500 |
| 2024 | $3,940 | $344,400 | $47,000 | $297,400 |
| 2023 | $3,711 | $307,700 | $47,000 | $260,700 |
| 2022 | $3,660 | $278,100 | $42,800 | $235,300 |
| 2021 | $3,524 | $251,000 | $42,800 | $208,200 |
| 2020 | $3,257 | $230,700 | $42,800 | $187,900 |
| 2019 | $2,927 | $211,200 | $38,700 | $172,500 |
| 2018 | $2,683 | $199,900 | $45,000 | $154,900 |
| 2017 | $2,641 | $188,900 | $42,800 | $146,100 |
| 2016 | $2,388 | $167,100 | $42,800 | $124,300 |
| 2015 | $2,344 | $171,500 | $47,400 | $124,100 |
| 2014 | $2,255 | $171,500 | $47,400 | $124,100 |
Source: Public Records
Map
Nearby Homes
- 30 Grant St
- 8 Wilson St
- 52 Grove St
- 4 Eagleton St
- 6 Eagleton St
- 13 Grove St
- 16 Old Farm Rd
- 256 Main St
- 6 Sullivan St
- 26 Maple St
- 4 Muzzy St
- 61 Hillsville and Spencer Rd
- 12 Crown St
- 2 Sunset Ln
- 50-52 & N Spencer
- 4 Crestview Dr Unit 55
- 2 Crestview Dr Unit 52
- 3 Bemis St
- 72 Wire Village Rd
- Lot 0 Langevin St